A Metal trace can be correct and still answer the wrong question.
I recorded the same deterministic Swift and Metal workload five times on an Apple M5 Pro. Each run had a known dispatch count: 400, 250, 120, 77, or 133.
In every capture, the interval count attributed to the target PID matched the dispatch count exactly. But the trace-wide totals also included other processes. Known-unrelated intervals made up 36.5% to 57.5% of the all-process interval count.
Those are event counts, not time or utilization. The useful result is narrower: a trace-wide count is not a workload count until each interval is attributed to a process.
Read the merged LLMTraceFX evidence pull request.
A Metal System Trace is wider than one workload
Apple's Metal performance guide points developers to Instruments for viewing CPU and GPU work together. The Metal System Trace template records a system timeline, not a private timeline for one process.
That distinction matters on macOS. WindowServer composites the desktop. Other apps can submit GPU work during the same recording. A trace can contain valid intervals that have nothing to do with the workload under test.
My capture boundary was specific:
- Apple M5 Pro, arm64
- macOS 26.6.2 (25G83)
- Xcode and Instruments 26.6
xctrace16.0 (17F113)- Metal System Trace template
- deterministic local compute workload with 262,144 threads per grid
- one command buffer per requested dispatch
- one process launched by
xctraceper capture - each capture ended when the workload exited, with a 10-second hard limit
These details belong beside the result. Unrelated-process counts can change with the host, foreground activity, toolchain, and capture boundary.
The first aggregation dropped process identity
xctrace export writes an Instruments trace as XML. Each capture advertised 82 schemas. The selected metal-gpu-intervals export had 18 columns.
The XML was not one ready-made CSV. Some cell values were inline. Others referred to values elsewhere in the document. The parser had to resolve those references, select the supported schema, and keep the process and PID fields attached to each interval.
My first aggregation effectively did this:
trace_total = sum(1 for interval in exported_intervals)
The total answered, "How many matching intervals are in this export?" It did not answer, "How many belong to my workload?"
The useful aggregation kept the owner:
from collections import Counter

intervals_by_pid = Counter(
    interval.pid
    for interval in exported_intervals
    if interval.pid is not None
)

target_intervals = intervals_by_pid[target_pid]
The production importer uses the trace table of contents to identify the target PID. The reduced example shows the boundary that changed the result.
Known dispatch counts gave me an oracle
Process names made the attribution look believable. They did not prove that the parser selected the right records or resolved every reference.
I needed a result known before the trace was parsed. The workload issued fixed dispatch counts, with one command buffer per dispatch. For each fresh capture, I compared the expected count with metal-gpu-intervals rows attributed to the target PID.
| Expected dispatches | Target PID | All processes | Known unrelated | Share | Unattributed |
|---|---|---|---|---|---|
| 400 | 400 | 726 | 326 | 44.9% | 0 |
| 250 | 250 | 394 | 144 | 36.5% | 0 |
| 120 | 120 | 230 | 110 | 47.8% | 0 |
| 77 | 77 | 181 | 104 | 57.5% | 0 |
| 133 | 133 | 253 | 120 | 47.4% | 0 |
Every expected dispatch count matched the target-PID interval count. Every exported interval had a parseable PID, so the unattributed count was zero in all five captures.
Known-unrelated count is:
all-process intervals - target-PID intervals - unattributed intervals
The share divides that derived count by the all-process interval count and rounds to one decimal place.
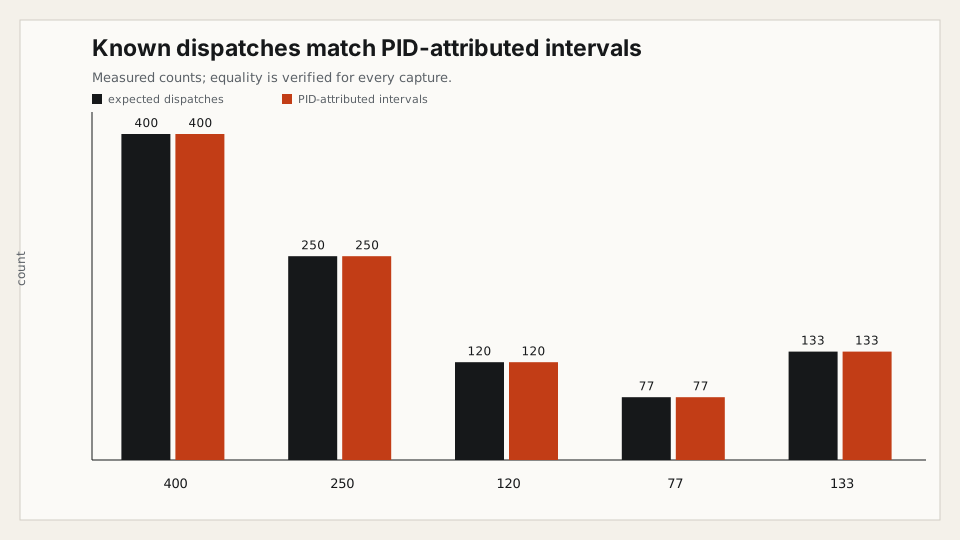
Matching several known inputs matters because a wrong parser can still produce tidy totals.
Trace-wide totals answer a different question
The target workload was not the only source of intervals. Known-unrelated processes accounted for 36.5% to 57.5% of the all-process interval count across the five captures.
The 250-dispatch capture had the lowest unrelated share. The 77-dispatch capture had the highest. That variation is one reason not to turn a single system-wide total into a workload claim.
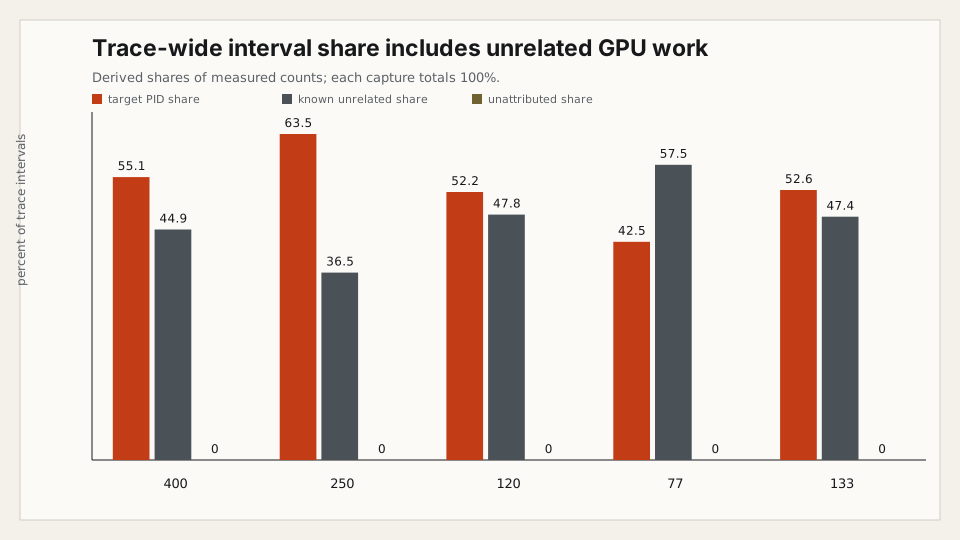
WindowServer was one known unrelated process in these captures. Its interval share ranged from 27.4% to 43.1%. I keep that as capture-specific evidence, not a general claim about macOS.
What the interval match does not say
An interval is a record in the selected exported schema. Counting those records does not turn them into time.
I do not use these counts as:
- GPU utilization or GPU busy percentage
- kernel time
- memory bandwidth
- occupancy
- GPU power or energy
- GPU memory footprint
I also do not use them to compare chips, models, frameworks, or users.
Those metrics stay absent because this evidence does not support them. The result is enough to test the attribution boundary. It is not enough to describe GPU performance.
Reproduce the attribution
The merged evidence bundle pins the workload, commands, public outputs, and expected checks.
uv sync --locked --extra dev --extra test
uv run python examples/metal_evidence/evidence_demo.py capability
make metal-evidence OUTPUT_DIR=/tmp/llmtracefx-metal-evidence
uv run python examples/metal_evidence/evidence_demo.py verify \
  --public-dir /tmp/llmtracefx-metal-evidence/public
OUTPUT_DIR must be absent or empty. The default run compiles the Swift workload, records five bounded captures, imports each trace, writes the public evidence bundle, verifies it, and deletes the private traces and XML.
The expected output includes:
capability=supported
template=Metal System Trace
capture_import=completed
dispatches=400 attributed=400 ... match=True
...
verification=passed
The fully parameterized capture command is:
uv run python examples/metal_evidence/evidence_demo.py capture \
  --output-dir '<OUTPUT_DIR>' \
  --dispatches 400 250 120 77 133 \
  --time-limit 10s
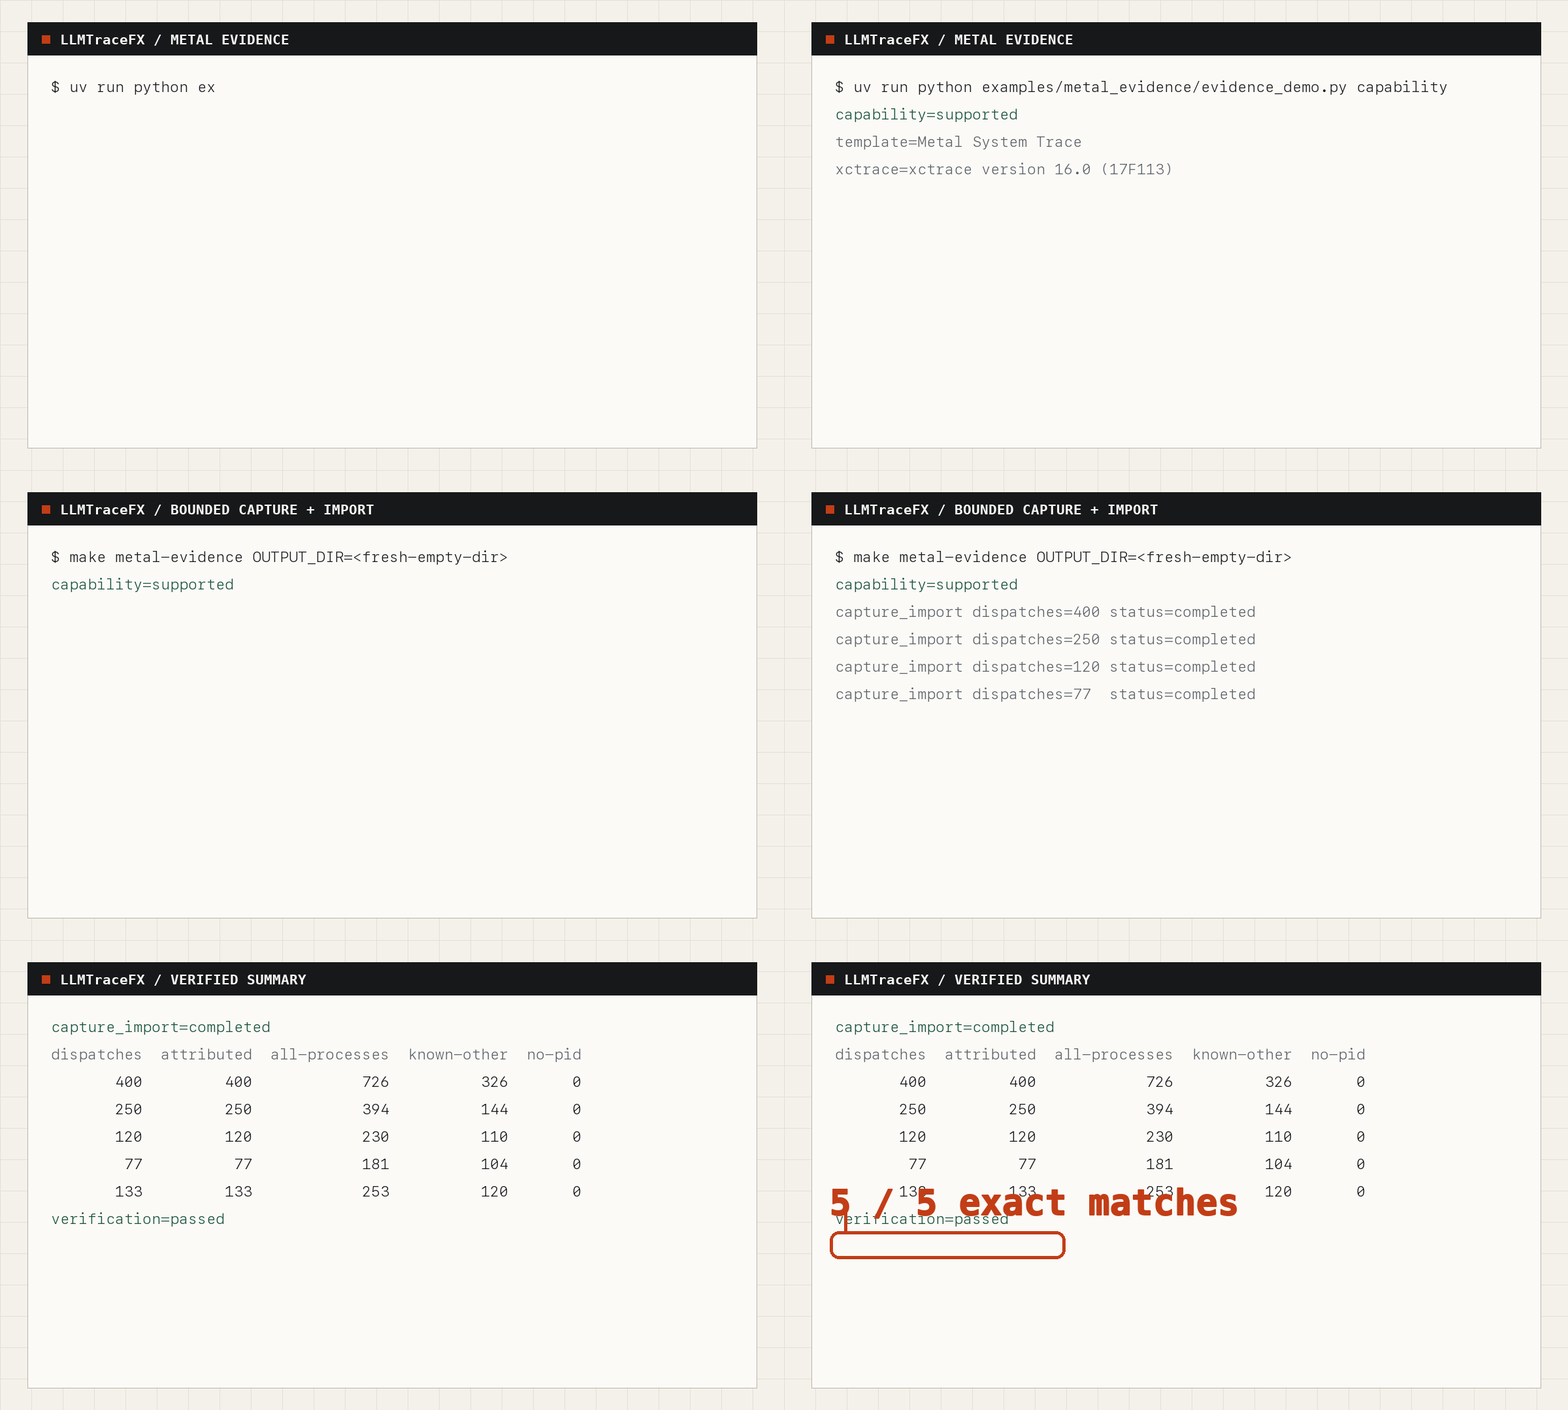
The evidence is available at immutable links:
- Merged evidence pull request
- Evidence bundle guide
- Capture manifest
- JSON summary
- CSV summary
- SHA-256 checksums
Share derived evidence, not a raw desktop history
A system trace can describe processes beyond the workload under test. That makes privacy review part of publication, not cleanup after publication.
The public bundle uses a closed filename allowlist and requires SHA256SUMS. Verification rejects unexpected files, directories, symlinks, home-directory paths, UUIDs, credential-shaped tokens, email addresses, and raw trace paths.
Raw .trace bundles and XML exports are not committed. The tool removes private artifacts after deriving the public bundle unless a user explicitly passes --retain-private for local diagnosis. No unrelated process identity is retained except the aggregate label for the standard macOS WindowServer service.
An earlier local run had a more dramatic process-share result. I did not publish it because its raw capture was not retained. The fresh bundle above supersedes it with evidence that someone else can inspect and reproduce.
The measurement boundary comes before the metric
The error started with a tempting shortcut: sum the rows, name the total, move on.
PID attribution changed the question. Known-count runs checked the answer. Unsupported metrics stayed empty.
A system trace can tell a precise story. First, it has to say whose story it recorded.
About LLMTraceFX
LLMTraceFX is an open-source, evidence-first toolkit I am building to understand and improve local and hosted LLM inference. It collects reproducible evidence, verifies workload quality, compares systems on like-for-like work, and leaves unsupported metrics empty instead of turning them into confident numbers.
It is still growing. If this approach is useful to you, I would appreciate you exploring the GitHub repository, sharing feedback, opening an issue, or giving it a star. Each one helps me learn what to improve next.
I write about AI agent infrastructure, security, context engineering, and the human side of building with AI. You can find all my writing on my writing page. Discuss this with me on X or connect with me on LinkedIn.