A benchmark screenshot can be true and still be useless.
It can show a model name, a latency, and a neat green bar. It rarely tells me which model revision ran, what code observed it, where the timer started, whether the response completed, which artifacts survived, or which price produced the cost. I can read the number. I cannot inspect its lineage.
That gap gets worse when the evidence comes from different systems. A local Metal trace, an MLX memory autopsy, a hosted API response, and a provider refusal do not share one measurement model. Putting them in the same table does not make them comparable. It can erase the boundary that made each result honest.
I have been working on an evidence catalog for LLMTraceFX because a folder of verified bundles is not yet a body of evidence. The catalog has to connect those bundles without pretending they measured the same thing.
This is the design I want from that graph: every result should carry enough lineage to answer where it came from, what it supports, and where it stops.
The evidence catalog PR merged at commit 266b42bc7659b3ab147f199f293bfc033324f763. Its canonical catalog.json has SHA-256 f155ae638a82fc1378afa5a4a28111fc3bfe39e2f6c44bc4be58e3a2d4be2004.
The catalog contains 9 verified evidence entries, 6 metadata-backed edges, and 63 bounded claim cells across 9 rows and 7 dimensions. It spans 8 evidence kinds and reports 0 unregistered candidates.
A result is the end of a chain
Suppose a screenshot says:
TTFT: 412 ms
Before I can use that result, I need at least eight answers.
- Model identity: Which repository, revision, quantization, and serving name ran?
- Runtime identity: Which collector, client, framework, driver, operating system, and relevant configuration ran?
- Workload identity: Which prompt artifact, token count, generation limits, repetitions, warmup policy, and stopping rule applied?
- Evaluator identity: Which checks decided that output was valid, complete, and eligible for a metric?
- Measurement scope: Was TTFT observed by a client, reported by a provider, derived from a trace, or inferred from logs?
- Artifact identity: Which manifest, summary, samples, logs, and checksums preserve the result?
- Pricing identity: Was cost estimated from a public price sheet, read from account billing, or reported as provider usage?
- Failure state: Did the run complete, truncate, time out, OOM, or stop before execution?
The screenshot is one leaf. Those answers are its lineage.
This is why a model name and a number are not enough. Qwen3-8B can mean an official source revision, a local conversion, a public MLX checkpoint, or a provider alias that can change behind an API. TTFT can start at request creation, socket write, response headers, first body byte, first server-sent event, or first visible content. Every label looks familiar. Their referents differ.
Lineage turns those hidden choices into inspectable data.
The evidence node
I use an evidence node as the smallest catalog object that can stand on its own. It is not necessarily one file and it is not necessarily one run. It is a typed record that binds an identity, a scope, a state, and one or more verified artifacts.
A reduced canonical entry looks like this:
{
	"evidence_id": "openrouter-glm-2k-comparison-20260902",
	"kind": "hosted_comparison",
	"status": "verified",
	"outcome": "comparison",
	"model": {
		"id": "z-ai/glm-5.3 and z-ai/glm-5.3-flash",
		"revision": "z-ai/glm-5.3-20260816 and z-ai/glm-5.3-flash-20260826"
	},
	"measurements": [
		{
			"scope": "client timing",
			"provenance": "network, gateway, queueing, and execution combined"
		}
	],
	"artifact_set_hash": "sha256:90e2ec60eec7d5cda570f526cb7efe607a57af8c359b8bb66e27c391aeba4527",
	"verifier": {
		"name": "openrouter-glm.verify",
		"version": "1"
	}
}
The catalog does not trust the label. A verifier adapter opens the declared artifact, applies the source bundle's rules, and returns a bounded result. One adapter may verify a Metal capture summary against known dispatch counts. Another may verify an MLX journal reached an OOM terminal state. A hosted collector adapter may require a normal terminal sentinel before a partial response can count as completed.
The adapter preserves source-specific semantics. It does not translate every source into a fake universal benchmark schema.
Typed edges
Nodes become useful when their edges say why they are connected. This catalog keeps its graph vocabulary small:
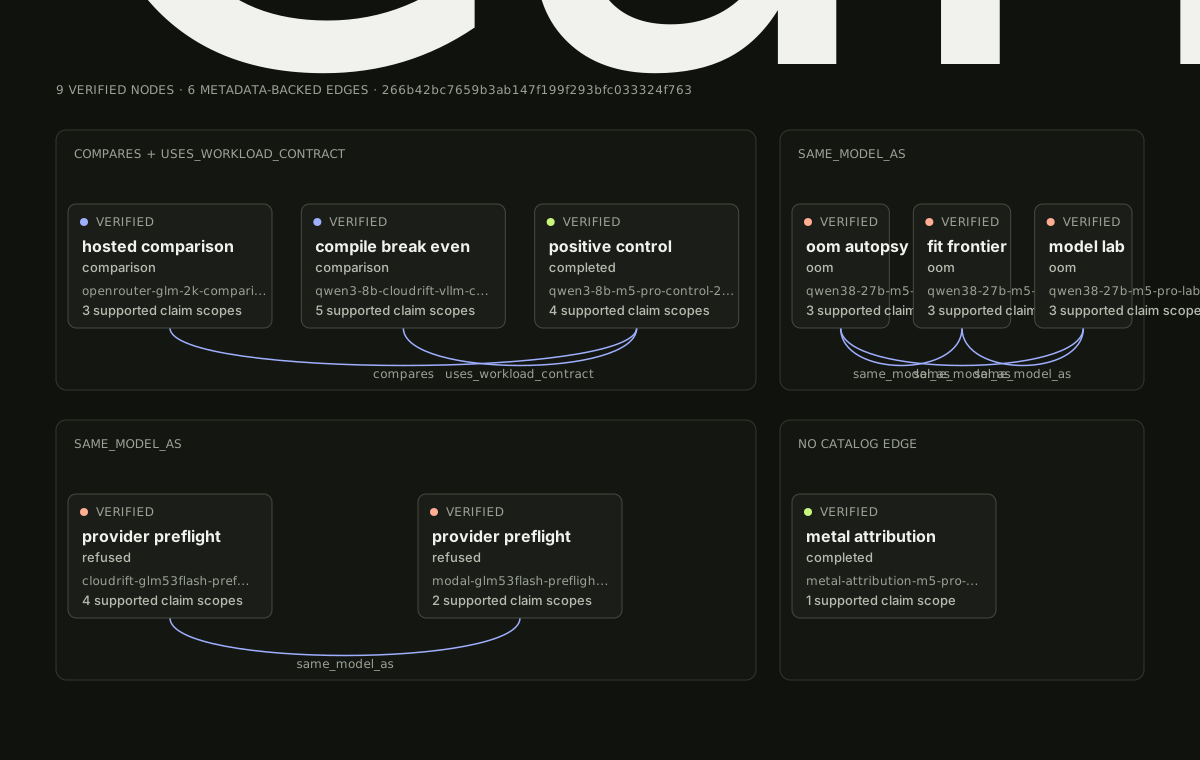
same_model_asconnects entries that pin the same model identity; andcomparesconnects the hosted GLM comparison to the Qwen3-8B control it names; anduses_workload_contractconnects the RTX 4090 compile comparison to the control whose pinned workload it reuses.
The graph contains 4 same_model_as edges: 3 among the 27B records and 1 between the provider preflights. It also contains 1 compares edge from the hosted GLM comparison to the Qwen3-8B control and 1 uses_workload_contract edge from the RTX 4090 compile comparison to that control. The last edge does not assert shared runtime or quantization identity. The graph does not turn model pins, verifier adapters, reports, or this article into extra graph nodes.
A different pipeline may need produces, verifies, supports, constrains, supersedes, or cites. Those names only help when their direction and inference rules are explicit.
An untyped arrow only says two things are related. A typed edge says what a reader may infer from the relation.
That difference blocks a common graph error. If a report cites a run and an article cites the report, the article does not verify the run. Verification is not transitive through a generic connection. The edge type keeps that boundary visible.
Content hashes
Every public artifact reference needs a content hash. A path says where a file was expected. A SHA-256 digest says which bytes the node names.
That gives the verifier a concrete check:
resolve declared relative path
reject path escape or symlink escape
read at most the declared bound
hash the bytes
compare with the catalog digest
run the source-specific verifier
A hash can detect changed bytes. It does not prove who created them, when they were created, or whether the collector observed everything that mattered. Unless a real cryptographic signature or attestation exists, I will not call the evidence signed. A checksum or hash chain can make changes detectable. It is not tamper-proofing.
The canonical file also carries an internal catalog hash, sha256:31062849a9ef988a1f5fbcf39abb39a7f2113162e4616be5cc5270f281bb2ce8. Its registry file has SHA-256 c09ffb9fd3dbb31fe45a146bf3b300249a31e420cd9a61134715577324cbbd90, while the catalog records the registry's internal hash as sha256:c890bfb783125536886b228c6236b6acfceb73e40c510ab8e6b1b5655ead309e. File hashes and internal content hashes are related checks, not interchangeable labels.
Source registry
The graph starts from an explicit registry.json. Each source declares:
- a stable
evidence_id; - a
public_path; - a closed
artifact_filesallowlist; - an adapter key;
- a bundle schema version and capture time;
- model, runtime, workload, outcome, and status fields;
- claim states, limitations, and dependencies; and
- a source commit when one exists.
The registry contains 9 sources and 8 adapter definitions. One adapter can verify more than one source. Each canonical entry records the adapter's exact name and version.
The registry is deliberately boring. It replaces heuristics.
I do not want a crawler that searches every README for links, guesses which JSON file looks like a summary, and promotes nearby prose into claims. README text is for people. It changes shape. It can name exploratory work beside publication work. An explicit registry makes the inclusion decision reviewable.
Claim matrix
The claim matrix is the graph viewed from the question a reader asks: what does this evidence support?
Each row names one evidence entry. Each column names one claim dimension: timing, quality, cost, memory, process attribution, model fit, or deployment readiness. Each of the 63 cells is one of three states:
supported;unsupported; ornot_applicable.
There is no implicit fourth state called "blank means probably no."
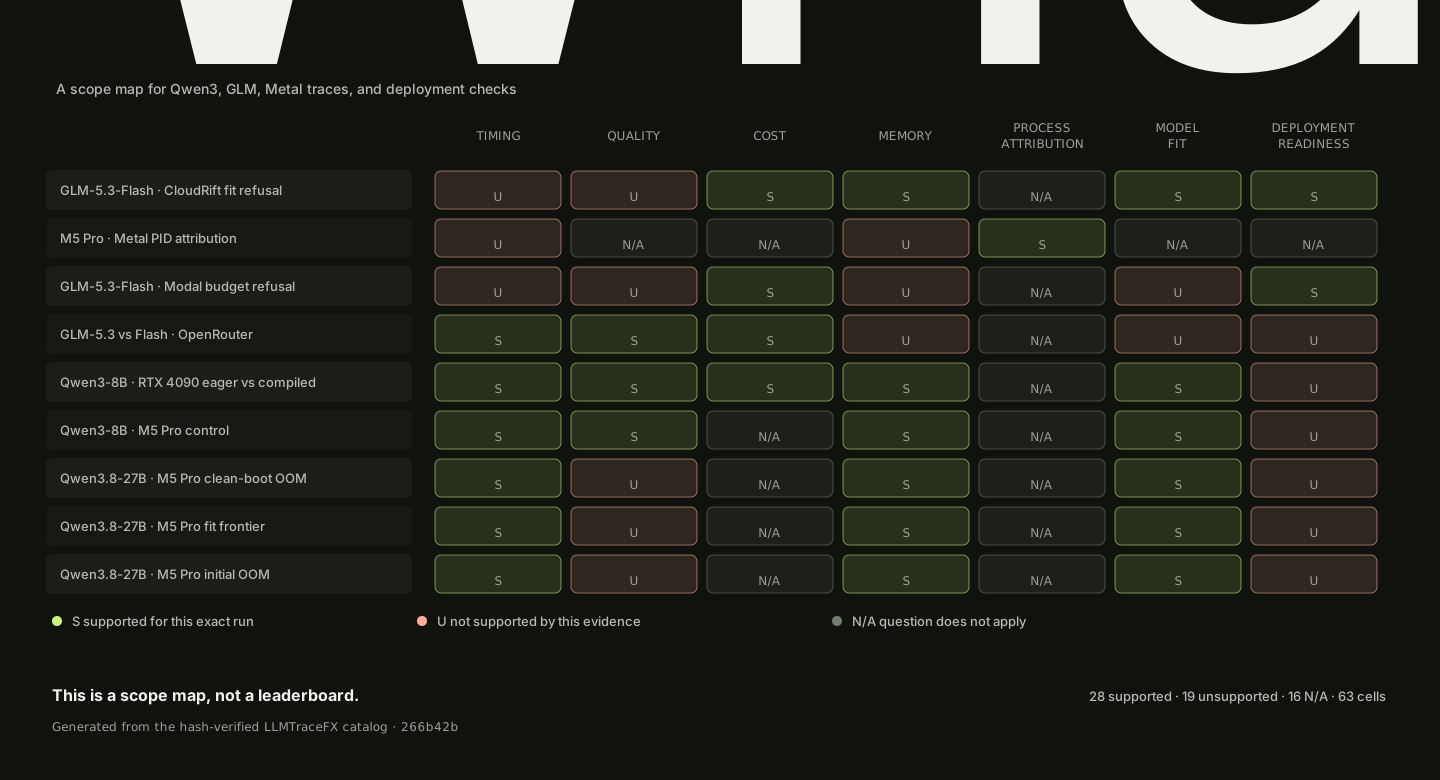
- GLM-5.3-Flash · CloudRift fit refusal
- Supported: cost, memory, model fit, deployment readiness. Not supported: timing, quality. Not applicable: process attribution.
- M5 Pro · Metal PID attribution
- Supported: process attribution. Not supported: timing, memory. Not applicable: quality, cost, model fit, deployment readiness.
- GLM-5.3-Flash · Modal budget refusal
- Supported: cost, deployment readiness. Not supported: timing, quality, memory, model fit. Not applicable: process attribution.
- GLM-5.3 vs Flash · OpenRouter
- Supported: timing, quality, cost. Not supported: memory, model fit, deployment readiness. Not applicable: process attribution.
- Qwen3-8B · RTX 4090 eager vs compiled
- Supported: timing, quality, cost, memory, model fit. Not supported: deployment readiness. Not applicable: process attribution.
- Qwen3-8B · M5 Pro control
- Supported: timing, quality, memory, model fit. Not supported: deployment readiness. Not applicable: cost, process attribution.
- Qwen3.8-27B · M5 Pro clean-boot OOM
- Supported: timing, memory, model fit. Not supported: quality, deployment readiness. Not applicable: cost, process attribution.
- Qwen3.8-27B · M5 Pro fit frontier
- Supported: timing, memory, model fit. Not supported: quality, deployment readiness. Not applicable: cost, process attribution.
- Qwen3.8-27B · M5 Pro initial OOM
- Supported: timing, memory, model fit. Not supported: quality, deployment readiness. Not applicable: cost, process attribution.
Source note. Every visual in this article, including this matrix, was generated locally by the deterministic article generator from the exact, hash-verified LLMTraceFX catalog at commit 266b42b; no external or stock image is used. The article export preserves the full commit and source hashes.
What those cells mean in practice
The matrix is an index. These are the measurements behind its states.
Metal PID attribution
- Observed reality
- Five controlled captures used known dispatch counts of 400, 250, 120, 77, and 133. Every target-PID interval count matched. Trace-wide totals still contained 36.5% to 57.5% known unrelated intervals.
- What it supports
- Target-process attribution for interval counts in the sanitized Metal export.
- What it does not prove
- Utilization, elapsed GPU time, bandwidth, occupancy, power, energy, or GPU memory.
Qwen3.8-27B OOM sequence
- Observed reality
- The initial lab row OOMed during its 2K warmup. The fit-frontier row OOMed at t256 and skipped larger tiers. In the clean-boot autopsy, the exact model occupied 16,081,490,933 bytes and a 256-token prompt OOMed before the first token. MLX active memory was 16,055,717,352 bytes after load and 18,727,905,294 bytes at OOM; peak memory reached 18,894,739,574 bytes.
- What it supports
- Three bounded records show the exact 27B checkpoint failed under their recorded host states. The clean-boot row pins the strongest machine-state contract.
- What it does not prove
- A universal capacity boundary or which tensor, cache, activation, object, or workspace caused each observed stage delta.
Qwen3-8B positive control
- Observed reality
- The official source was self-converted with pinned
mlx-lm. All 12 measured cases passed across 2K, 8K, and 16K. Mean total latency, correct cases per minute, and peak MLX memory were exactly2595.6080727501103 ms / 23.115970638983462 / 5605114236 bytes,4977.312041500227 ms / 12.054699303505034 / 6201600040 bytes, and10287.574406000658 ms / 5.832278594748485 / 7107602472 bytes. - What it supports
- The exact self-converted 8B checkpoint completed and passed the pinned evaluators through the requested 16K tier.
- What it does not prove
- Why the 27B checkpoint failed. The model, conversion, runtime identity, and memory envelope differ.
Hosted GLM comparison
- Observed reality
- Eight OpenRouter calls cost $0.00615262 in final usage blocks. Both models passed 4/4. GLM-5.3 reached 18.296 and 18.096 correct cases per minute on structured and prose work; Flash reached 9.836 and 6.382. Flash delivered 13,035 and 8,125 correct cases per dollar versus 709 and 682.
- What it supports
- GLM-5.3 was faster while Flash bought more correct cases per dollar in both exact workload strata.
- What it does not prove
- A universal winner, server-only timing, provider memory, hardware fit, or a ranking against local Qwen, whose contract was incompatible.
Modal budget refusal
- Observed reality
- The conservative lifecycle estimate was $48.218112 against a $10 cap. The plan stopped before authentication, provider use, weight download, GPU allocation, or spend.
- What it supports
- The budget gate refused the paid experiment before execution.
- What it does not prove
- Model performance, startup, hardware fit, runtime memory, or deployment readiness.
CloudRift hardware refusal
- Observed reality
- The observed listing offered 8 V100 GPUs with 128,000,000,000 aggregate bytes. The exact model inventory was 328,366,172,318 bytes, leaving a 200,366,172,318-byte shortfall. Nothing was provisioned and inferred experiment spend was zero.
- What it supports
- The exact observed hardware shape could not hold the published model inventory under the authorized plan.
- What it does not prove
- That every CloudRift configuration is incompatible, or anything about model throughput and quality.
RTX 4090 compile crossover
- Observed reality
- One RTX 4090 ran exact Qwen3-8B eager and compiled lifecycles. Eager initialization took 64.600270 seconds; 12 request latencies summed to 22.861589948 seconds, with 10/12 correct and 426 output tokens. Compiled initialization took 119.143334 seconds; requests summed to 17.046030152 seconds, with 12/12 correct and 444 tokens. No crossing appeared through request 12.
- What it supports
- Repeating the exact observed outcome sequence in a frozen time calculation projects a crossing at request 113. That is arithmetic on the 12 measured requests, not a later measurement. The cost and teardown artifacts also support a $0.484358 boot-to-console list-rate lower bound, null provider spend, completed local cleanup, and user-confirmed provider teardown.
- What it does not prove
- An observed, causal, output-controlled, replicated, or general compile break-even. Output arrays and lengths differed at 7, 8, 11, and 12; correctness differed at 11 and 12. The request-113 crossing is non-observed.
Measurements do not become compatible by sharing a row
The strongest reason to keep a graph is that heterogeneous evidence should stay heterogeneous.
Client TTFT and provider usage
A client can observe request start, headers, bytes, server-sent events, visible content, and stream termination. It cannot observe hidden server queueing or kernel execution unless the provider exposes those stages.
A provider can report input tokens, output tokens, cached tokens, or reasoning tokens. Those are provider-accounted values. They are not the same as client-observed event counts.
Dividing provider-reported tokens by a client-observed interval may be valid only when the interval covers those tokens. If reasoning tokens arrive outside the client's visible-content window, that division invents a rate the client never observed.
Keep the timing node and usage node separate. Connect them to one run. Do not flatten them into one measurement object.
The openrouter-glm-2k-comparison-20260902 entry applies that boundary. Eight pinned hosted requests completed and passed their evaluators. Timing is client-observed. Provider-reported request usage totaled USD 0.00615262. The account delta is a separate lag-prone observation, and provider memory was not exposed.
Interval counts and utilization
The merged Metal evidence used known dispatch counts to check PID attribution. The target-PID interval counts matched the known workload counts. Trace-wide totals also contained unrelated processes.
Those are counts of records in one exported schema. They are not GPU busy time, occupancy, bandwidth, power, or utilization. A catalog can connect the capture, importer, verification result, and report. It cannot upgrade a supported interval-count claim into an unsupported utilization claim.
MLX allocator, RSS, and swap
MLX active memory, MLX cache memory, MLX peak memory, process RSS, and system swap describe different scopes.
- Active and cache are allocator categories.
- Peak is a high-water mark over time.
- RSS is an operating-system view of one process.
- Swap is a host-wide state.
They cannot be stacked into one "memory used" bar. Null values cannot be replaced with zero to make the chart line up. The 27B OOM autopsy kept these series separate because the separation was the result.
Exploratory and publication evidence
An exploratory run can answer a local engineering question. A publication run carries a stronger operating contract: pinned inputs, declared machine state, bounded collection, public artifacts, and a verifier result.
The Qwen3-8B positive control is useful because it completed a separately pinned path. It does not retroactively turn the 27B OOM into a model-size law. It also does not become a publication run merely because its numbers fit beside one.
The graph should connect exploratory and publication nodes only with an edge that states the relation. It should never erase the distinction.
Estimated, account, and provider usage cost
Cost needs lineage too.
An estimate applies a price schedule to observed or reported usage. Account cost comes from billing data. Provider usage cost may come from an API response or dashboard. These sources can differ because of discounts, cached-token pricing, batch pricing, minimums, credits, taxes, or a price change.
$0.42 without a cost source is not portable evidence. The graph should preserve the price artifact, effective date, currency, usage source, and calculation. It should not merge three cost meanings into one field.
Completed, OOM, and refused
A completed run reached its declared terminal condition and passed its evaluator. An OOM reached a resource failure after execution began. A refusal stopped before the requested benchmark because a provider, budget policy, or hardware policy rejected the plan.
These are not scores on one success scale. They are terminal states with different causal positions.
Negative evidence belongs in the graph
The easiest way to bias a benchmark is to publish only completed runs.
That does not mean every failure is a benchmark result. It means failures and refusals should remain connected to the decisions they constrain.
The 27B OOM evidence says that one exact workload failed before its first token under one pinned runtime and machine state. It does not produce TTFT, throughput, quality, or a completed-run score. Still, it constrains the next experiment: do not claim the same workload completed, do not escalate the context tier, and do not treat loaded weights as a fit proof.
The Modal budget refusal and CloudRift hardware refusal sit even earlier. No paid run should be implied when a budget gate stopped the request. No hardware performance result should be implied when the requested hardware was unavailable or rejected.
In a decision graph, I would use constrains edges:
budget refusal --constrains--> hosted experiment plan
hardware refusal --constrains--> requested hardware comparison
OOM terminal state --constrains--> next context tier
The canonical evidence graph does not add those three edges. Its only relations are same_model_as, compares, and uses_workload_contract. Instead, the refusal and OOM constraints live in each entry's outcome, supported claims, unsupported claims, and limitations. That is still machine-readable, and it avoids claiming a graph relation that the catalog does not declare.
They do not use failed_benchmark as a catch-all label. The benchmark may never have started.
This matters for future planning. A refusal records which option was unavailable, under which request and policy, at which time. A later run can supersede that constraint if the budget or hardware changes. Deleting the refusal would make the later choice look arbitrary.
The catalog binds the examples to exact IDs:
- Metal PID attribution:
metal-attribution-m5-pro-20260831; - 27B clean-boot OOM autopsy:
qwen38-27b-m5-pro-clean-boot-autopsy-20260901; - Qwen3-8B positive control:
qwen3-8b-m5-pro-control-20260902; - hosted GLM comparison:
openrouter-glm-2k-comparison-20260902; - Modal budget refusal:
modal-glm53flash-preflight-20260902; and - CloudRift hardware refusal:
cloudrift-glm53flash-preflight-20260902; and - RTX 4090 compile crossover:
qwen3-8b-cloudrift-vllm-compile-20260903.
The two other nodes preserve the 27B fit frontier and earlier lab OOM: qwen38-27b-m5-pro-fit-frontier-20260901 and qwen38-27b-m5-pro-lab-oom-20260831.
Claim boundaries are data
I do not want claim limits buried in prose after the chart. They should be machine-readable.
Consider three questions against the Metal evidence:
Did target-PID interval counts match known dispatch counts?  supported
Does the evidence report GPU utilization?                   unsupported
Does hosted token pricing apply to this local capture?      not_applicable
unsupported means the source is in scope but does not establish the claim. not_applicable means the claim does not belong to that source.
Missing is different again. Missing means the catalog has no declared state. That is a graph integrity error, not a negative answer.
The same rule applies to numbers:
first_token_ms: null
completion_tokens: null
estimated_cost_usd: null
In an OOM before first token, null is not zero. Zero milliseconds would mean an observed event at the start boundary. Zero completion tokens could be a valid completed response under a strange protocol. Zero cost could mean a free tier. Each zero is a claim.
I would rather reject a report than let absence turn into a strong number.
The graph must fail closed
An evidence graph is another parser. It needs the same suspicion as any parser that can publish claims.
Explicit registry, no README scraping
Only registry entries become roots. The graph builder must not discover sources from prose, glob every JSON file, or follow arbitrary links.
Bounded reads
Every source gets a maximum catalog size, artifact count, artifact size, node count, and edge count. A verifier should reject an oversized input before parsing or hashing the full body. A catalog is not permission to read the repository without a bound.
Path containment
Artifact paths must be relative to an allowed public root. Reject absolute paths, .. segments, symlink escapes, device paths, and URLs where a local path is required. Resolve first. Then confirm the result remains inside the declared root.
Duplicate IDs and dangling edges
Evidence IDs must be unique across the catalog, registry, graph, and claim matrix. Every edge endpoint must exist. Every claim row must provide exactly the seven declared dimensions. Silent last-write-wins behavior can replace one source with another.
Cycles
The evidence lineage is a directed acyclic graph. Cycles make derivation order ambiguous and can hide circular support:
report supports claim
claim validates report
A topological sort should consume every node. If it cannot, generation stops and reports the cycle.
Source commit binding
The catalog export must name an exact 40-character commit. Its registry, nodes, edges, claim matrix, schema, checksum file, and rendered graph must come from that same tree. A branch URL is not enough. A pull request URL is useful context, but the merged commit binds the bytes.
Deterministic reports
Given the same catalog bytes and generator version, the report should be byte-for-byte identical. Sort stable identifiers. Use fixed layout rules. Do not write the current time into a rendered artifact. Hash the outputs and write a manifest.
The draft generator will run only after:
catalog merge state = merged
catalog source commit = exact commit
eight canonical artifact hashes = verified
all nine entry and registry source statuses = verified
entry verifier names and versions = registered adapters
required example aliases = present
graph integrity = passed
claim matrix completeness = passed
public path and credential-shaped data checks = passed
The upstream verifier command is uv run llmtracefx-evidence verify; make evidence-catalog runs the full catalog target. The canonical directory has no standalone verifier-report artifact, so I do not invent one. Verification state lives in catalog.json and registry.json, adapter identity lives in the registry, and artifact bytes are bound by SHA256SUMS.
Public lineage needs a privacy boundary
The graph should make public evidence easier to inspect without making private collection easier to reconstruct.
I want public nodes to carry derived facts and public artifact references. I do not want them to carry:
- home-directory or workspace paths;
- credentials, environment values, or provider request IDs;
- raw prompts or model responses;
- unrelated process identity or target PIDs;
- device serials or stable device identifiers;
- account IDs, invoices, credits, or private price agreements; or
- raw traces that contain other applications or users.
This affects graph design.
A public node can say target process intervals matched known dispatches without storing the target PID. A workload node can bind a prompt by public fixture hash without exposing a private prompt. A refusal node can record budget policy rejected request before execution without publishing an account balance.
Privacy review is not a regex at the end. The canonical registry uses public_path plus a closed artifact_files list for each source. The portfolio generator also rejects home paths and credential-shaped data, but that scan does not replace the allowlist.
One lineage, end to end
I can read one entry through five stages:
model pin
  -> collection
  -> verification
  -> report
  -> article claim
For qwen38-27b-m5-pro-clean-boot-autopsy-20260901, the model pin is mlx-community/Qwen3.8-27B-4bit@3e6447f082e89cc7f0bc6e5441afd38dfce760ff. Collection resolves to its public path and source commit 2519bc8da309656d2e2ce2a7063f19b0dfb4c9ed. Verification resolves through oom_autopsy_v1 to oom-autopsy.verify_bundle version 1. The report is oom-autopsy-summary.json, inside artifact set sha256:1096de514bcdd74201d367d098352da831efa9f21d85aa2993af0e2787c56030.
Those five stages are an explanatory projection of fields in one entry. They are not five new nodes or four new edges in the canonical graph. The article cites the report. It does not become part of the evidence that verifies it.
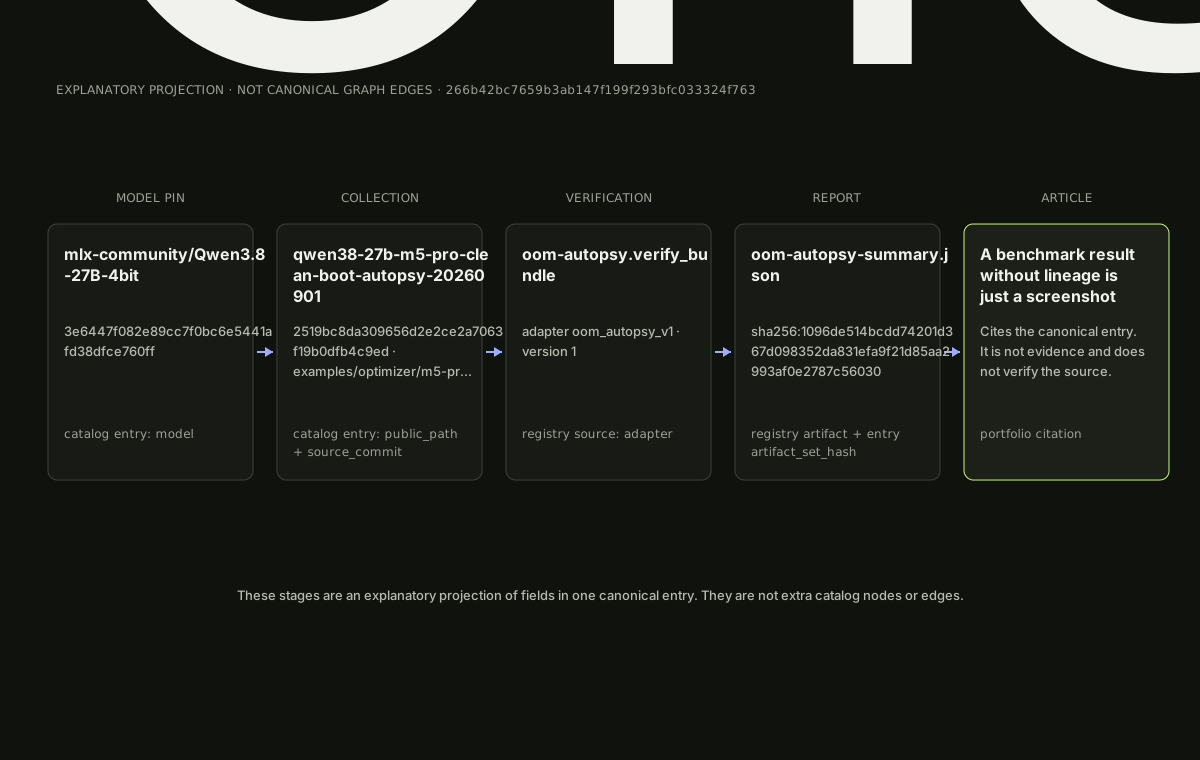
This figure matters more to me than a large graph. A graph overview shows coverage. One resolved path shows whether the system can answer a reader's next question.
What I learned
The first lesson was that composability does not require flattening. A graph can connect client timing, provider usage, allocator counters, process memory, refusal records, and publication reports while keeping their types intact.
The second was that negative evidence needs a first-class state. An OOM can constrain the next tier. A budget refusal can prove no paid request ran. A hardware refusal can explain why a comparison is absent. None needs a fake score.
The third was that claim boundaries belong beside artifact hashes. Integrity answers whether the named bytes changed. A claim matrix answers whether those bytes establish the sentence I want to write. I need both.
The last lesson was that graph generation has to fail closed. If a source ID is duplicated, an edge dangles, a cycle appears, a path escapes, or a commit does not match, no report is better than a plausible report.
An evidence-lineage checklist
You can adapt this without adopting my schema.
- Give every model, runtime, workload, evaluator, collection, report, and refusal a stable typed identity.
- Pin repositories and models to exact revisions. Keep provider aliases labeled as aliases.
- Bind each public artifact path to a content hash.
- Register sources explicitly. Do not discover publication evidence from README prose.
- Use verifier adapters that preserve source-specific semantics.
- Type every graph edge. Do not let citation imply verification.
- Record measurement scope with each metric: client, provider, allocator, process, host, trace, account, or estimate.
- Keep incompatible series separate. Do not sum allocator counters, RSS, and swap into one value.
- Keep exploratory and publication evidence distinct.
- Record terminal states such as completed, truncated, timeout, OOM, budget refusal, and hardware refusal.
- Connect negative evidence with
constrainsorsupersedesedges instead of fake benchmark scores. - Store claim status as
supported,unsupported, ornot_applicable. - Treat missing as an error or unknown state. Never convert null to zero.
- Reject duplicate IDs, dangling edges, cycles, absolute paths, path escapes, and oversized inputs.
- Bind the source registry, graph, verification surfaces, and article to one exact commit.
- Make report generation deterministic and hash its outputs.
- Publish derived public artifacts, not raw traces, prompts, responses, credentials, account data, or stable device identity.
- Say
hash,checksum,sealed, ortamper-evidentonly when that is what exists. Saysignedonly when a real cryptographic signature exists and is verified. - Resolve one full lineage by hand before trusting the graph overview.
- Make the article cite the report. Do not let the article become part of the evidence that proves its own claim.
Conclusion
A benchmark is not only a measurement. It is a chain of decisions about identity, scope, validity, and failure.
The graph does not make unlike measurements comparable. It makes their relationships inspectable. It lets a completed hosted run sit beside a local OOM and a provider refusal without turning all three into one score.
That is the point of lineage. The screenshot can keep the number. The graph keeps the reason I should believe it.
About LLMTraceFX
LLMTraceFX is an open-source, evidence-first toolkit I am building to understand and improve local and hosted LLM inference. It collects reproducible evidence, verifies workload quality, compares systems on like-for-like work, and leaves unsupported metrics empty instead of turning them into confident numbers.
It is still growing. If this approach is useful to you, I would appreciate you exploring the GitHub repository, sharing feedback, opening an issue, or giving it a star. Each one helps me learn what to improve next.
I write about AI agent infrastructure, security, context engineering, and the human side of building with AI. You can find all my writing on my writing page. Discuss this with me on X or connect with me on LinkedIn.