The fastest passing system in my experiment was not the cheapest one.
That sounds obvious. Yet model comparisons often hide the choice by compressing quality, latency, and cost into one score. The result looks decisive because the objective disappeared.
I ran a small hosted comparison between z-ai/glm-5.3 and z-ai/glm-5.3-flash through OpenRouter. Both systems passed all four measured cases. GLM-5.3 produced more passing cases per minute in both workload strata. Flash produced far more passing cases per dollar.
Neither result cancels the other. They answer different questions.
The evidence comes from eight paid inference requests on September 2, 2026. It is merged in LLMTraceFX PR #57 and pinned to commit debd8fa3f2d4bbed3ccdaad40fd1be80e264fe87.
Start with a contract, not a model name
The comparison fixed the parts that could change the answer:
- OpenRouter model IDs
z-ai/glm-5.3andz-ai/glm-5.3-flash - first-party Z.AI
z-ai/fp8route - fallbacks disabled
- provider parameter support required
- two safe 2K workloads
- two measured repetitions per model and workload
- no paid warmups or retries
- 96 output-token cap
- temperature 0 and top-p 1
- mandatory reasoning at low effort
The two workloads stayed separate:
structured-json-profile-extraction@1, checked by exact required-field matchingprose-reasoning-two-train-gap@1, checked by an exact answer pattern
Each stratum also bound the workload prompt hash, context tier, evaluator, output cap, temperature, and top-p. That matters because two rows are not comparable just because they fit in the same table.
The sample is tiny. Two repetitions can point to a useful next decision. They cannot establish a latency distribution, production service-level objective, or broad model quality.
Quality was a gate, not the objective
Both systems passed 4/4 cases. Within each workload, that meant two passing measured runs per system.
The comparison policy required:
- completed or skipped terminal status
- 100% pass rate
- at least two measured repetitions
Only after a system cleared those constraints did the policy rank it. The declared objective was to maximize correct cases per minute.
This order prevents a fast failed response from winning. It also prevents cost from rewarding unusable output. But 4/4 on two small workloads is only a bounded gate. It does not show that either model is generally correct, capable, safe, or better for another task.
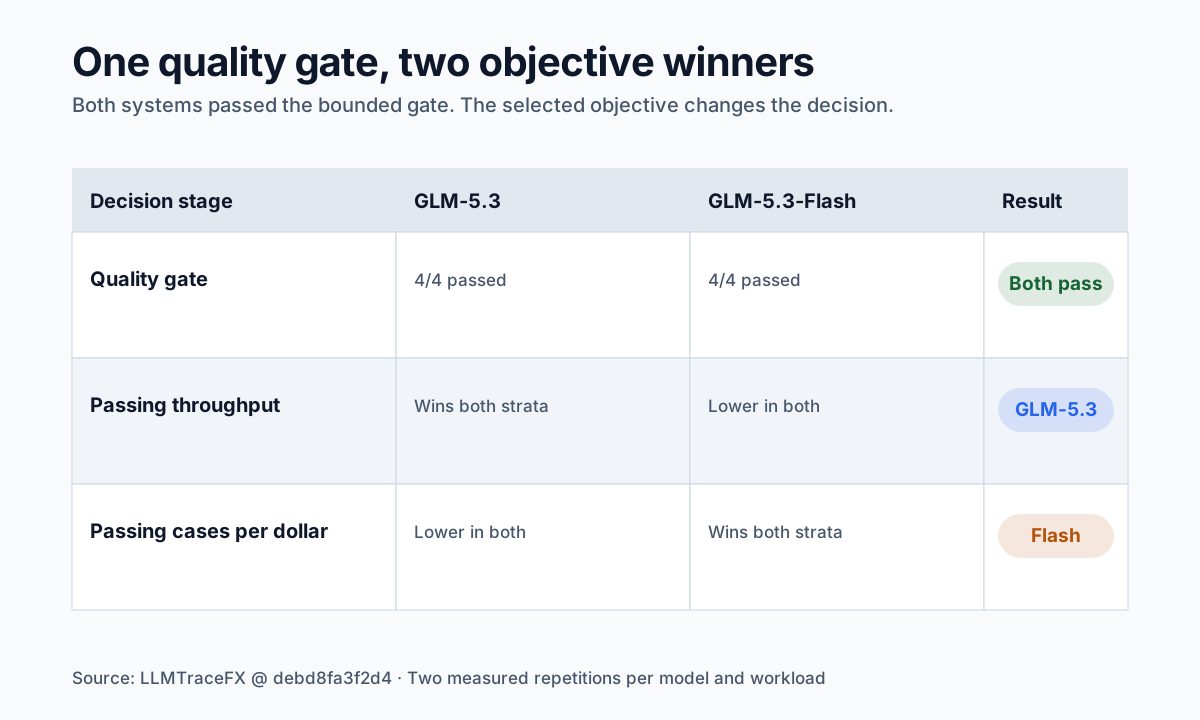
The two workloads gave the same tradeoff
I did not average the structured and prose results. Their evaluators and output shapes differ, so one mean would erase the boundary the experiment was built to preserve.
| Workload | System | Passing | Mean total | Correct/min | Estimated cost | Correct/$ |
|---|---|---|---|---|---|---|
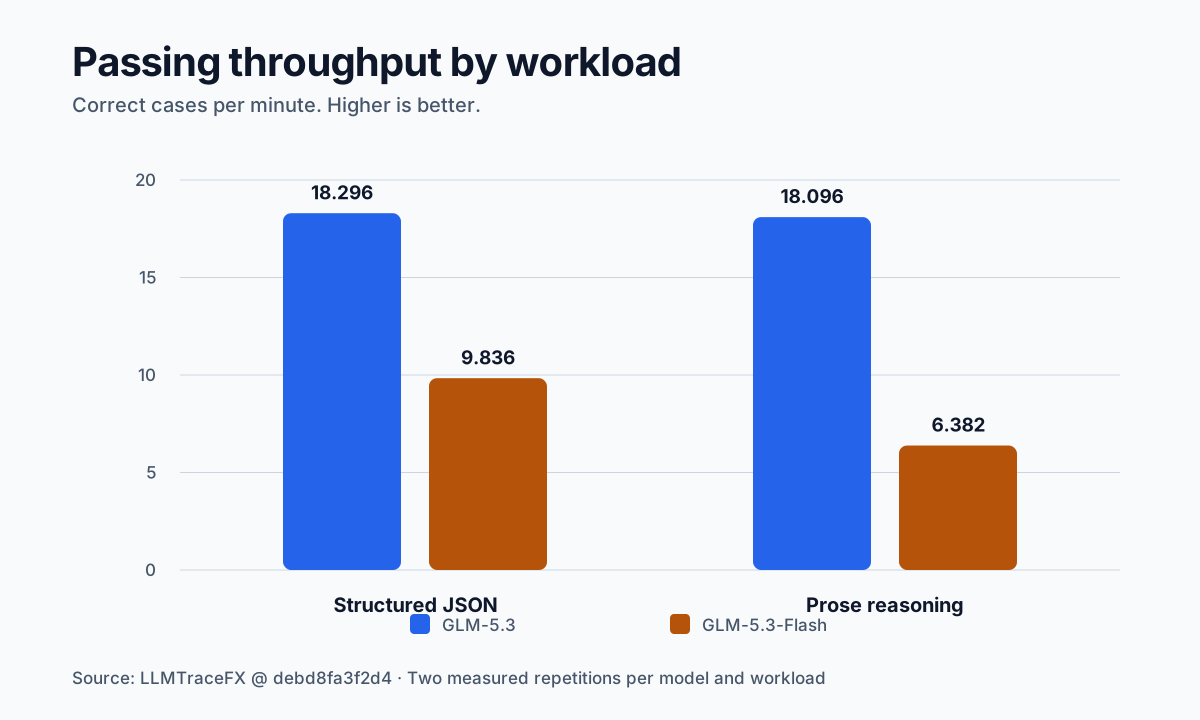
| Structured JSON | GLM-5.3 | 2/2 | 3,279 ms | 18.296 | $0.00282232 | 709 |
| Structured JSON | Flash | 2/2 | 6,100 ms | 9.836 | $0.00015343 | 13,035 |
| Prose reasoning | GLM-5.3 | 2/2 | 3,316 ms | 18.096 | $0.00293072 | 682 |
| Prose reasoning | Flash | 2/2 | 9,402 ms | 6.382 | $0.00024615 | 8,125 |
GLM-5.3 was faster on both passing strata. Its mean total latency stayed near 3.3 seconds. Flash took about 6.1 seconds on structured JSON and 9.4 seconds on prose.
Flash reversed the result when the question became cost efficiency. It bought about 18.4 times as many passing structured cases per dollar and 11.9 times as many passing prose cases per dollar.
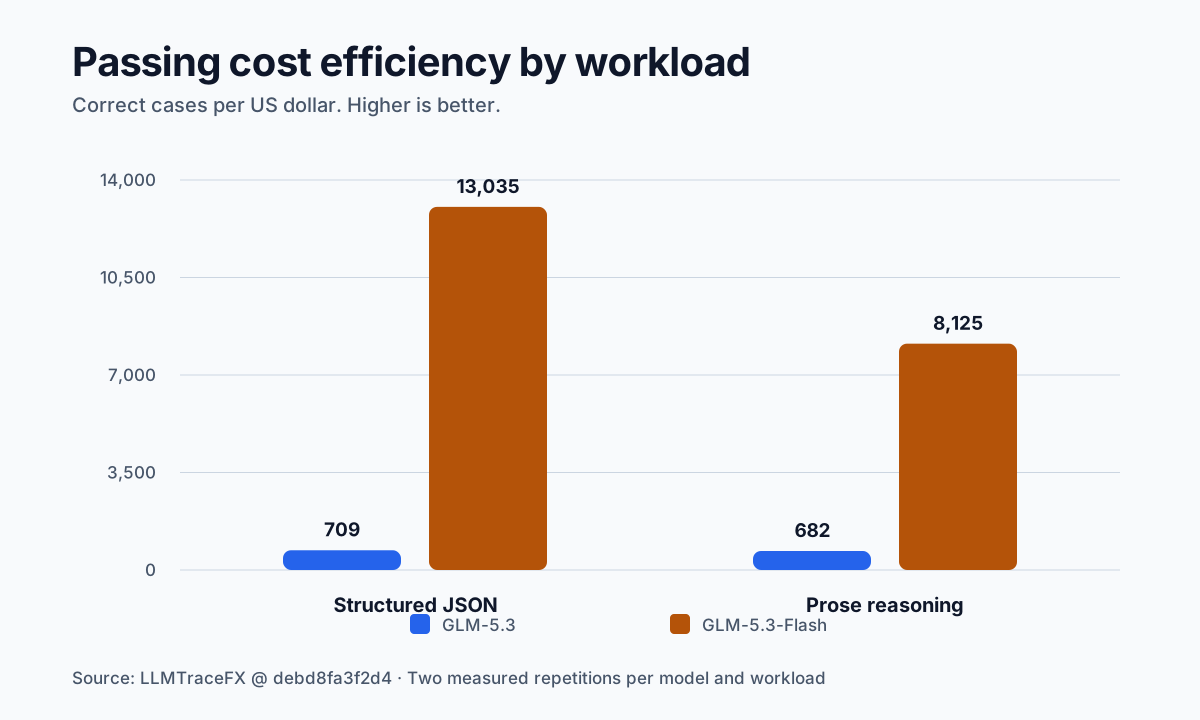
The charts use separate scales because cases per minute and cases per dollar are different units. Putting them on one axis would turn a decision into decoration.
The metrics are simple, but their scope is not
LLMTraceFX computes passing throughput as:
correct cases per minute =
  passing timed cases / (sum of their total milliseconds / 60,000)
Failed cases do not enter the numerator or the passing-time denominator. The quality gate still sees them. If there are no passing timed cases, the metric stays unavailable instead of becoming zero or infinity.
Cost efficiency is:
correct cases per dollar =
  passing cases / estimated total cost in USD
The estimate requires provider-reported usage for every run and a matching pinned pricing entry. A partial total is not reported because it would understate spend. A zero cost also leaves the ratio undefined rather than pretending the system offers infinite value.
These ratios are useful because they attach a unit to a decision. They are scope-bound because every term depends on this workload, evaluator, route, timing boundary, usage report, and pricing snapshot.
Client timing and provider usage answer different questions
The latency in this comparison is client-observed wall time. It includes the path through the client, network, OpenRouter gateway, provider queue, model execution, and streamed response. It is not server-side model time.
The usage came from each final provider usage block. It reported prompt, completion, cached prompt, reasoning, and cost fields. LLMTraceFX kept that accounting separate from client timing.
That separation blocks two easy mistakes.
First, an API client cannot infer server compute from wall time. A slower result could come from queueing or transport. A faster one does not prove faster kernels.
Second, missing or zero-looking usage needs provenance. The captured rows reported zero reasoning tokens, but both endpoints required reasoning. That zero does not prove there was no hidden internal computation. It says the provider reported zero tokens in that field.
Caching also changed some second repetitions. Provider-reported cached prompt tokens were nonzero in one Flash row and two GLM-5.3 rows. The comparison recorded those values and applied the pinned cached-input rates. It did not normalize them away or assume every cache field was zero.
The model-level generation metadata showed the expected Z.AI builds, but the raw correlation identifiers were discarded for privacy. The public evidence therefore treats those as uncorrelated model-level observations, not as proof attached to individual completion rows.
Comparability is a contract, not a visual table
The local Qwen3-8B 2K control completed at about 23.12 correct cases per minute. I did not put that number beside the hosted GLM systems as a third-ranked bar.
The contracts differ:
- different model and system identities
- local MLX runtime and timing instead of hosted client timing
- thinking disabled locally while hosted GLM reasoning was mandatory
- a local seed that the pinned hosted route did not advertise
- exploratory local evidence without a clean-boot assertion
A chart can align any three numbers. That does not make their denominators equal.
Excluding Qwen is not a missing result. It is the result of checking the comparison boundary. The local run remains useful context for a separate systems question, but it does not belong in this hosted ranking.
The budget gate reduced risk, but it was not absolute
The experiment had a $5 authorized lifetime cap. Before network access, the local plan reserved a conservative maximum for all eight requests:
authorized lifetime cap:  $5.00000000
planned ceiling:           $0.07453260
final usage-block cost:    $0.00615262
remaining authorization:   $4.99384738
The run made eight paid inference requests, with no paid warmups or retries. Its plan priced an intentionally conservative input ceiling, then each final provider usage block supplied the cost used for the recorded total.
An immediate account query moved by only $0.00039958, equal to the Flash calls. I keep that delta separate. The account endpoint can lag, and account activity can include unrelated work. It is corroborating evidence, not the primary spend truth for these requests.
The historical run used budget-ledger schema v1. An independent review found two limits: a missing ledger could be initialized, and the ledger claim did not bind the full request, routing, and price configuration. The committed evidence preserves that executed state instead of rewriting it after the fact.
The later schema v3 design binds the ledger identity and path into the plan, binds the full request configuration, maintains a separate monotonic state anchor, and rejects missing or rolled-back state while those files remain authoritative.
That is still a local application gate. A malicious operator who can delete or restore both user-writable ledger and anchor files can defeat it. Only a provider-side limit or an external monotonic service can close that boundary.
So I call this a bounded local spend control, not an absolute provider billing cap.
Modal would answer a different question
Some of my other experiments run models on Modal's GPUs.
I do not need a Modal run to repeat this API quality, latency, and cost comparison. A self-hosted run would remove OpenRouter's gateway and provider queueing, so it would not confirm these hosted timings.
Modal becomes useful only when the question changes:
- does the exact checkpoint load?
- what hardware fits it?
- how does tensor parallelism change memory and throughput?
- what does the framework do at load, prefill, and decode?
- how does hardware placement change the result?
Those are good experiments. They need their own pinned runtime, hardware, budget, and measurement contract. No Modal credits were requested or spent for this comparison.
What I learned
The hard part was not calculating a winner. It was refusing to ask three questions at once.
Quality worked best as a gate. Both systems had to complete and pass the bounded evaluators before latency or cost could matter. That made a failed fast response and a cheap wrong response ineligible without pretending 4/4 proved broad quality.
Workload identity mattered as much as model identity. Structured output and prose had different evaluators and timing. Keeping them separate showed that the tradeoff repeated across both strata without inventing an average task that nobody ran.
Provider evidence needed two ledgers in my head. Client timing described what the caller waited for. Provider usage described what the provider said it counted and charged. Joining those fields is useful. Treating either one as server truth is not.
The exclusion taught me the most. A local result can be real, reproducible, and still be wrong for the leaderboard. Comparability comes from the contract, not the visual proximity of numbers.
A practical comparison checklist
- Pin the model ID, provider route, and captured pricing.
- Disable fallbacks so the requested system cannot silently change.
- Bind output limits, sampling, reasoning controls, and provider parameter support.
- Verify workload version, prompt identity, context tier, and evaluator.
- Gate on bounded quality before ranking latency or cost.
- Choose one objective. Do not hide several goals inside one score.
- Keep client-observed timing separate from provider-reported usage.
- Report cache and reasoning fields with provenance. Do not turn missing evidence into zero.
- Reserve the worst-case budget before network access, then reconcile each final usage record.
- Seal the public artifacts with hashes and a closed file set.
- Report exclusions and their contract mismatches instead of forcing every run into one table.
Inspect the evidence
The immutable bundle at commit debd8fa3f2d4bbed3ccdaad40fd1be80e264fe87 contains:
- experiment manifest
- measurements
- comparison JSON and rendered HTML
- budget plan and executed ledger
- pricing snapshot and pricing manifest
- sanitized generation metadata
- SHA-256 checksums
- bundle verifier and load-bearing tests
The bundle publishes no credentials, prompts, responses, reasoning text, account identifiers, raw headers, provider request identifiers, or private paths.
What the evidence does not prove
This evidence does not prove a universal winner, broad model quality, a production latency target, server-side model time, or a provider-independent result. The provider's zero reported reasoning tokens do not prove that no hidden computation occurred. The local budget gate is not an absolute provider billing cap.
The local Qwen result does not belong in the hosted ranking. Its model, runtime, reasoning, seed, system identity, and timing contracts differ.
Conclusion
Pick the quality gate first. Then name the objective you are willing to optimize.
If passing throughput matters for these two hosted workloads, this experiment supports GLM-5.3. If passing cases per captured dollar matter more, it supports Flash. It does not prove a universal winner, broad model quality, a production latency target, or a provider-independent result.
Readers should pin the route, workload, evaluator, timing boundary, usage provenance, and price before comparing. They should also publish the exclusions. The system left out of a leaderboard can be the clearest sign that the comparison is honest.
About LLMTraceFX
LLMTraceFX is an open-source, evidence-first toolkit I am building to understand and improve local and hosted LLM inference. It collects reproducible evidence, verifies workload quality, compares systems on like-for-like work, and leaves unsupported metrics empty instead of turning them into confident numbers.
It is still growing. If this approach is useful to you, I would appreciate you exploring the GitHub repository, sharing feedback, opening an issue, or giving it a star. Each one helps me learn what to improve next.
I write about AI agent infrastructure, security, context engineering, and the human side of building with AI. You can find all my writing on my writing page. Discuss this with me on X or connect with me on LinkedIn.