The model checkpoint was 16,081,490,933 bytes. The Mac had 25,769,803,776 physical bytes, exactly 24 GiB. A clean-boot run with 79% free memory and zero swap still ended in a Metal out-of-memory error before the first token.
This comparison looked reassuring:
16,081,490,933 bytes < 25,769,803,776 physical bytes
It was also the wrong fit test.
The left side measured model files. The right side measured physical memory shared by the CPU, GPU, operating system, and every other process. Neither number described the inference workload at its peak.
The useful evidence came from the stages between load and failure.
The clean-boot result
I ran the pinned mlx-community/Qwen3.8-27B-4bit checkpoint at revision 3e6447f082e89cc7f0bc6e5441afd38dfce760ff on an Apple M5 Pro. The checkpoint contained 15 files totaling 16,081,490,933 bytes.
The publication plan recorded:
- operator-confirmed clean boot;
- 82% free memory from macOS
memory_pressure; - zero swap used;
- MLX 0.32.2; and
- no model load or download during the plan step.
The actual run started with 79% free memory and zero swap. The available-memory estimate was 20,358,144,983 bytes, derived by multiplying the memory_pressure free percentage by physical memory. That is approximate system headroom. It is not free GPU memory or exact free unified memory.
The workload requested 256 prompt tokens. The tokenizer produced 256 tokens. MLX/Metal reported insufficient memory during prefill. No first token appeared. There was no completion, evaluator result, quality metric, or throughput metric.
The child exited with code 2. It did not time out. Descendant processes were cleaned up, and the stage journal reached its explicit OOM terminal record.
This result is published in LLMTraceFX PR #55 at exact commit 6b82cf276ee1e1cef03a0c92847082f872c8feba.
File bytes are not a memory budget
Apple documents a unified memory model in which the CPU and GPU share system memory. MLX describes the same property in its unified-memory documentation pinned to 0.32.2: either device can operate on the same arrays without first moving them between separate CPU and GPU pools.
Shared access removes one class of transfer. It does not turn a checkpoint's storage size into an inference budget.
The clean-boot autopsy measured one part of the loaded representation. Immediately after model load, MLX reported 16,055,717,352 active bytes and the same peak value. The checkpoint byte count and MLX active count were close, but they were not the same measurement.
The remaining mechanisms require care:
- Allocator state. MLX tracks live buffers and reusable cached buffers separately.
- Prompt activations and temporary work. Prefill evaluates the full prompt through the model. The autopsy observed allocator growth across that boundary, but it did not attribute each byte to a tensor or kernel workspace.
- KV cache. Autoregressive inference retains key and value state across positions. MLX's KV-cache engineering note shows that cache growth and buffer reuse are runtime concerns. This run did not reach decode, and the evidence does not isolate a KV-cache byte count.
- Lazy evaluation. MLX records compute graphs before evaluating them. Its lazy-evaluation documentation states that operations do not compute until evaluation and that accessing an array can trigger evaluation. Pressure can appear after the Python code has described the work.
- Framework and process overhead. Process RSS can include the Python runtime, tokenizer, mapped files, native libraries, and other state outside MLX allocator counters.
- Other system consumers. macOS and other processes use the same physical memory. System swap is host-wide, not owned by one inference process.
Only the allocator changes below were measured at the prefill boundary. The mechanism list explains what may exist, not where every byte went.
Four scopes, four questions
MLX 0.32.2 defines its allocator counters in mlx/memory.h. The Metal allocator updates software counters in allocator.cpp. Apple defines a task's resident_size in XNU's task_info.h, and the kernel fills it from the task's physical-memory ledger in task.c.
Those are separate accounting systems:
| Measurement | Scope | Useful question | What it does not mean |
|---|---|---|---|
get_active_memory() |
Bytes in actively used buffers tracked by the MLX allocator. | How much live allocator-tracked memory does MLX report here? | Not cached buffers, full process memory, system memory, or exact free GPU memory. |
get_cache_memory() |
Freed buffers retained by MLX and not returned to the system allocator. | How much reusable memory sits in the MLX allocator cache? | Not active model state, not another RSS value, and not proof that every byte can satisfy the next request. |
get_peak_memory() |
High-water mark of MLX active memory since process start or the last reset. | What was the largest allocator-tracked active value? | Not current memory, peak RSS, active plus cache, or a system-wide peak. |
| Current and maximum RSS | Resident memory macOS accounts to the isolated workload process. | What process-resident footprint does the operating system report? | Not MLX-only memory, model-only memory, storage bytes, or exact free GPU memory. |
| System swap | Host-wide swap state sampled at the checkpoint. | How did system swap change around the run? | Not process-attributed swap, bytes caused by this model, or available GPU capacity. |
None of these is exact free GPU or unified memory. They also must not be added into one total.
MLX active and cache are allocator categories. Peak is a high-water mark across time. RSS is an operating-system view of a process. Swap is system-wide. Adding them would mix categories, scopes, and time.
Apple's recommendedMaxWorkingSetSize is not exact free GPU memory either. Apple calls it an approximation of the footprint a device can allocate without affecting runtime performance. MLX uses that advisory value while deriving default allocator limits in its 0.32.2 Metal allocator.
An advisory threshold is not a live count of unclaimed bytes.
The stage record
The autopsy used discrete checkpoints instead of high-frequency polling. Periodic sampling was disabled.
| Stage | Offset (s) | MLX active | MLX cache | MLX peak | Current RSS | Swap used |
|---|---|---|---|---|---|---|
| Before model load | 2.427717333 | 1,032 | 0 | 1,032 | 124,731,392 | 0 |
| After model load | 6.741843708 | 16,055,717,352 | 18,548 | 16,055,717,352 | 1,127,120,896 | 5,245,627,269 |
| After tokenization | 6.839624416 | 16,055,717,352 | 18,548 | 16,055,717,352 | 922,681,344 | 5,611,129,405 |
| Before prefill | 6.926870375 | 16,055,717,352 | 18,556 | 16,055,717,360 | 929,824,768 | 5,923,531,653 |
| Caught OOM | 24.982202125 | 18,727,905,294 | 76,438,712 | 18,894,739,574 | 527,089,664 | 4,070,372,802 |
| Cleanup | 24.991859666 | 18,341,875,182 | 462,468,824 | 18,894,739,574 | 531,005,440 | 4,070,372,802 |
All memory values are bytes. The full evidence also records maximum RSS and total swap. The table keeps one RSS series and one swap series to stay readable; the publication summary preserves every field.
The checkpoint immediately before prefill reported:
MLX active: 16,055,717,352 bytes
MLX cache:          18,556 bytes
MLX peak:   16,055,717,360 bytes
The caught-OOM checkpoint reported:
MLX active: 18,727,905,294 bytes
MLX cache:      76,438,712 bytes
MLX peak:   18,894,739,574 bytes
The observed checkpoint-to-checkpoint changes were:
MLX active: +2,672,187,942 bytes
MLX cache:     +76,420,156 bytes
MLX peak:   +2,839,022,214 bytes
Those deltas are observations, not causal allocation attribution. They do not say which tensor, cache, activation, framework object, or backend workspace owned each byte.
The RSS and swap series make the same point about scope. Current RSS fell between the before-prefill and OOM checkpoints. Swap used also fell. Neither movement cancels the allocator growth, and none of the series can substitute for another.
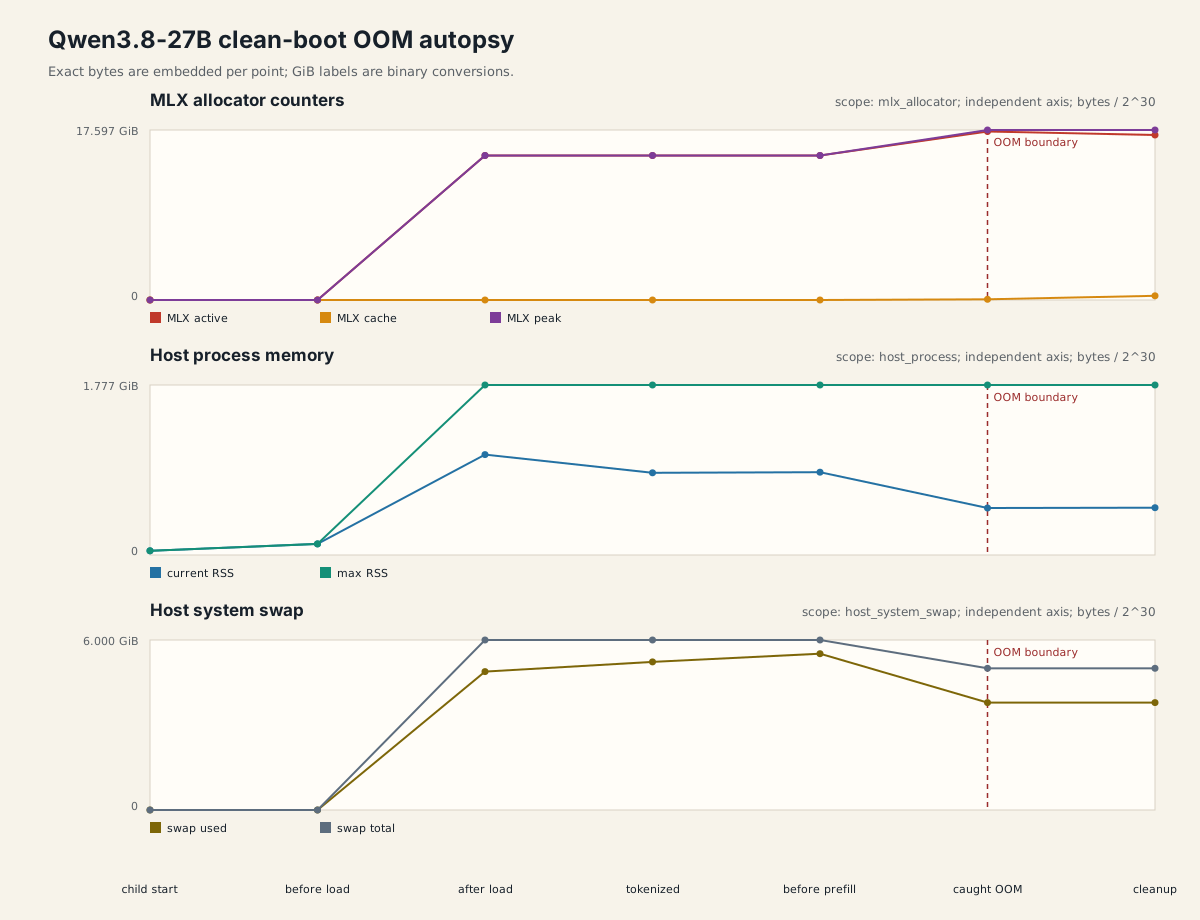
Why stage boundaries survived the OOM
A memory failure can kill the process before it writes a final report. The autopsy therefore used an isolated child process and a durable stage journal.
The child recorded named transitions:
child start
before model load
after model load
after prompt tokenization
immediately before prefill generation
caught OOM
cleanup
The final evidence manifest binds the report files to SHA-256 values. The journal reached oom, the child returned its expected failure code, and the parent cleaned descendants. A missing first-token record remained missing rather than becoming a zero-duration result.
This design also stopped the experiment at the first failure. It did not attempt larger contexts after the 256-token OOM. There were no warmup or measured repetitions to blur together.
Stage-boundary probes answer a narrower question than polling: what did each scope report before and after a named operation? They also reduce observer work during a constrained run. The evidence does not measure or subtract the overhead of ps, getrusage, sysctl, or MLX counter reads.
What the result proves
The merged evidence supports this result:
- The exact 15-file checkpoint occupied 16,081,490,933 bytes.
- The publication plan recorded an operator-confirmed clean boot, 82% free memory, and zero swap.
- The run preflight recorded 79% free memory and zero swap.
- The requested and actual prompt length was 256 tokens.
- MLX active memory was 16,055,717,352 bytes after load and immediately before prefill.
- MLX active memory was 18,727,905,294 bytes when the OOM was caught.
- MLX peak memory reached 18,894,739,574 bytes.
- MLX/Metal reported insufficient memory before a first token.
- The child exited with code 2 without timing out.
- The journal completed and descendant processes were cleaned.
It does not prove:
- that every 24 GiB M5 Pro will fail;
- that 256 tokens is a universal context boundary;
- that the model can never run with a smaller prompt or a different runtime path;
- where every byte went;
- that an allocator delta identifies its cause;
- that RSS or swap measures GPU memory;
- that active, cache, peak, RSS, and swap can be reconciled into one exact total; or
- that the output would have met a quality bar if generation had started.
The title is shorthand. The checkpoint files fit under the physical-memory number. This exact clean-boot inference workload did not complete.
What I learned
A successful weight load is only a load result. It says the stored checkpoint could become allocator-tracked model state. It says nothing about whether prefill, KV state, temporary work, and runtime overhead will fit beside it.
The stage boundary changed the diagnosis. MLX peak grew by 2,839,022,214 bytes between the checkpoint immediately before prefill and the caught OOM. The run failed before its first token at an actual prompt length of 256 tokens. That does not identify the owner of each byte, but it rules out the simpler story that loaded weights were the whole workload.
The durable journal was more useful than the final exception. It preserved the last completed stage, allocator counters, RSS, swap, child exit, and cleanup state after the OOM. High-frequency polling would have answered a different question while adding more observer work. This experiment needed reliable boundaries, not more samples.
The clean boot removed one uncontrolled starting condition. It did not turn one machine state into a universal 24 GiB rule. Negative evidence should narrow the next experiment: stop escalating context, keep the exact model and runtime pin, then test a separately pinned smaller control or a different quantization. Changing the pin after failure would rewrite the question.
A practical OOM checklist
- Pin the model repository, revision, runtime versions, and artifact manifest.
- Record requested prompt tokens and the tokenizer's actual count.
- Snapshot MLX active, cache, and peak counters before and after model load, tokenization, and prefill.
- Record process RSS and system swap as separate scopes. Never add them to MLX counters or call the result free GPU or unified memory.
- Persist each stage checkpoint atomically so an OOM cannot erase the last known state.
- Run each tier in an isolated child process and record its exit, timeout, descendant cleanup, and terminal journal state.
- Stop at the first OOM. Do not escalate context after the safety boundary fails.
- Keep missing first-token, completion, evaluator, quality, and throughput fields null or explicitly unavailable.
- Hash the public artifacts and bind the report to the exact code and evidence commits.
- Separate exploratory runs from operator-confirmed publication runs at collection time.
A smaller control completed
A separate exploratory control used the official Apache-2.0 Qwen/Qwen3-8B@b968826d. Its 15 source files totaled 16,397,461,266 bytes. The workflow converted it once with mlx-lm 0.31.3@ed1fca4, using affine 4-bit quantization with group size 64. The eight-file output totaled 4,619,328,159 bytes. It is a local self-conversion, with no claim of byte-equivalence to a public MLX checkpoint.
All 12 measured safe-workload cases passed:
| Requested | Mean actual | Passing | Mean total | Correct/min | Max MLX peak |
|---|---|---|---|---|---|
| 2,048 | 1,613 | 4/4 | 2,595.61 ms | 23.12 | 5,605,114,236 bytes |
| 8,192 | 6,373 | 4/4 | 4,977.31 ms | 12.05 | 6,201,600,040 bytes |
| 16,384 | 12,697 | 4/4 | 10,287.57 ms | 5.83 | 7,107,602,472 bytes |
These are host wall-clock durations, derived correct-case rates, and MLX allocator peak values from the observed exploratory state. No clean-boot assertion was made. This 8B self-conversion is a different model and system identity from the packaged 27B checkpoint. Its completion shows that the pinned smaller control path ran through evaluation. It does not explain why the 27B run OOMed or prove that parameter count was the cause.
The control evidence is merged in LLMTraceFX PR #56 at commit a6077adaf7135e2a2e360aeae4a73b6b411b3493. The immutable bundle includes the conversion summary, evidence summary, evidence manifest, and SHA-256 checksums.
Inspect the evidence
The publication bundle is pinned to commit 6b82cf276ee1e1cef03a0c92847082f872c8feba:

Primary sources
- MLX 0.32.2
memory.hdefines active, cache, peak, and reset semantics. - MLX 0.32.2 Metal allocator implementation shows how active and peak counters change and when cached buffers are released.
- MLX 0.32.2 memory tests exercise active, cache, peak, reset, evaluation, and synchronization behavior.
- MLX 0.32.2 lazy-evaluation documentation describes graph recording, explicit evaluation, and implicit evaluation triggers.
- MLX 0.32.2 unified-memory documentation describes CPU and GPU access to the same arrays.
- MLX 0.32.2 KV-cache documentation describes cache growth, copying, and buffer reuse.
- Apple's Metal documentation explains resource storage modes for Apple GPUs and
recommendedMaxWorkingSetSize. - Apple's XNU source defines
resident_size, connects it to the task physical-memory ledger intask.c, and exposes VM counters invm_statistics.h. - Apple's open-source
vm_statreads host VM, compressor, page, and swap counters. - The PagedAttention paper studies KV-cache memory management for LLM serving. It does not measure this MLX run.
Conclusion
Treat model bytes as provenance, not capacity planning. A fit test needs the prompt you will use, the runtime you will ship, and stage checkpoints that remain readable after failure.
When a run fails, keep the negative result intact. Stop the next larger tier, preserve the pin, and change one declared variable in the next experiment. A smaller control or another quantization can answer a new question without erasing the first one.
The useful question is not whether the weights fit. It is whether the full inference workload fits at the context, runtime, and machine state you need.
About LLMTraceFX
LLMTraceFX is an open-source, evidence-first toolkit I am building to understand and improve local and hosted LLM inference. It collects reproducible evidence, verifies workload quality, compares systems on like-for-like work, and leaves unsupported metrics empty instead of turning them into confident numbers.
It is still growing. If this approach is useful to you, I would appreciate you exploring the GitHub repository, sharing feedback, opening an issue, or giving it a star. Each one helps me learn what to improve next.
I write about AI agent infrastructure, security, context engineering, and the human side of building with AI. You can find all my writing on my writing page. Discuss this with me on X or connect with me on LinkedIn.