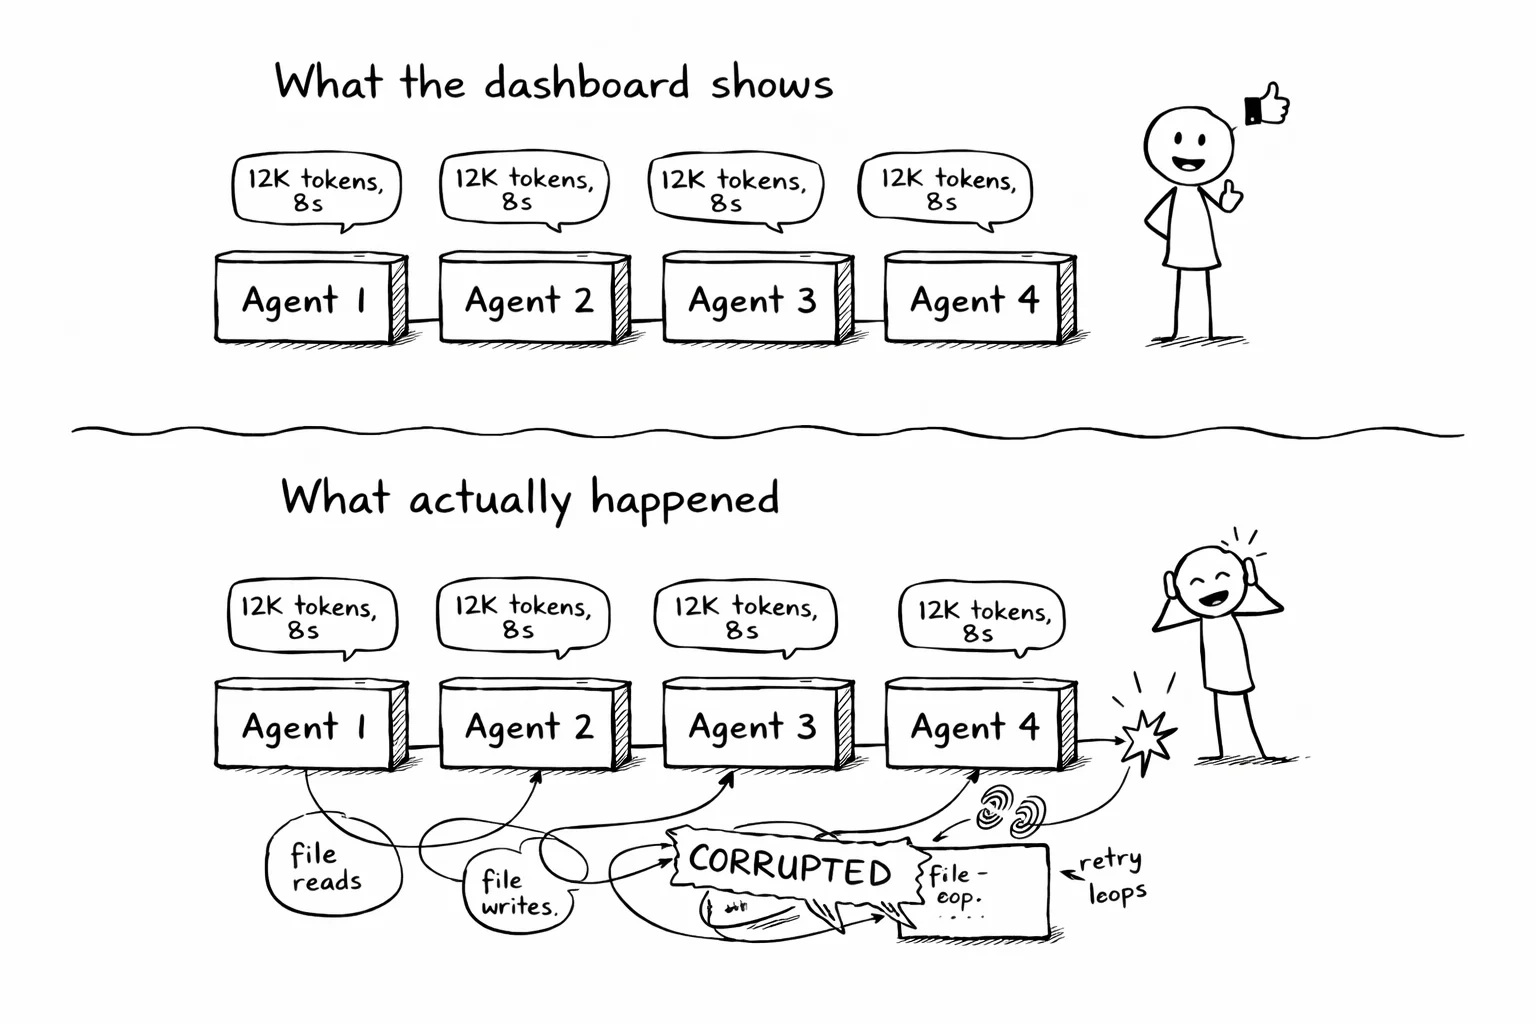
Your agent says "I'll read the config and update the tests." Your dashboard confirms it: one tool call, 12,000 tokens, 8 seconds.
What actually happened: it read the config, failed to parse it, retried with a regex, wrote to the wrong directory, caught the error, deleted the file, re-read the config, and then updated the tests. Six steps between "I'll do it" and "done." The dashboard shows two of them.
This gap is manageable with one agent. With a fleet of fifty, it is where every hard bug hides.
The fleet is here
The numbers are public.
Stripe deployed Claude Code to 1,370 engineers with zero-config signed enterprise binaries, as described in their case study with Anthropic. They migrated 10,000 lines of Scala to Java in 4 days, a task estimated at 10 engineering weeks.
Spotify ships 1,500+ agent-authored changes through Honk, their background coding agent. Their verification loop combines deterministic verifiers (Maven build, test suite) with an LLM-as-judge that vetoes roughly 25% of agent sessions. They also built a separate multi-agent advertising platform using Google ADK, reducing media plan creation from 15-30 minutes to 5-10 seconds.
Cursor 3 launched with multi-agent orchestration. 35% of Cursor's own PRs are now agent-authored. Their self-driving codebases research describes running hundreds of agents in parallel, shipping 1,000 commits per hour, with custom logging they had to build because nothing off the shelf went deep enough.
Anthropic's Claude Code spawns fork sub-agents that share the parent's prompt cache. I covered the internals in The plumbing behind Claude Code.
These are production systems running dozens to hundreds of agents at once.
The missing layer
LangSmith, Arize, and Braintrust trace LLM calls. They show token counts, latencies, model responses. For understanding model behavior, cost, and latency across a fleet, they are the right tool.
But there is a layer below the model that these platforms were not designed to capture:
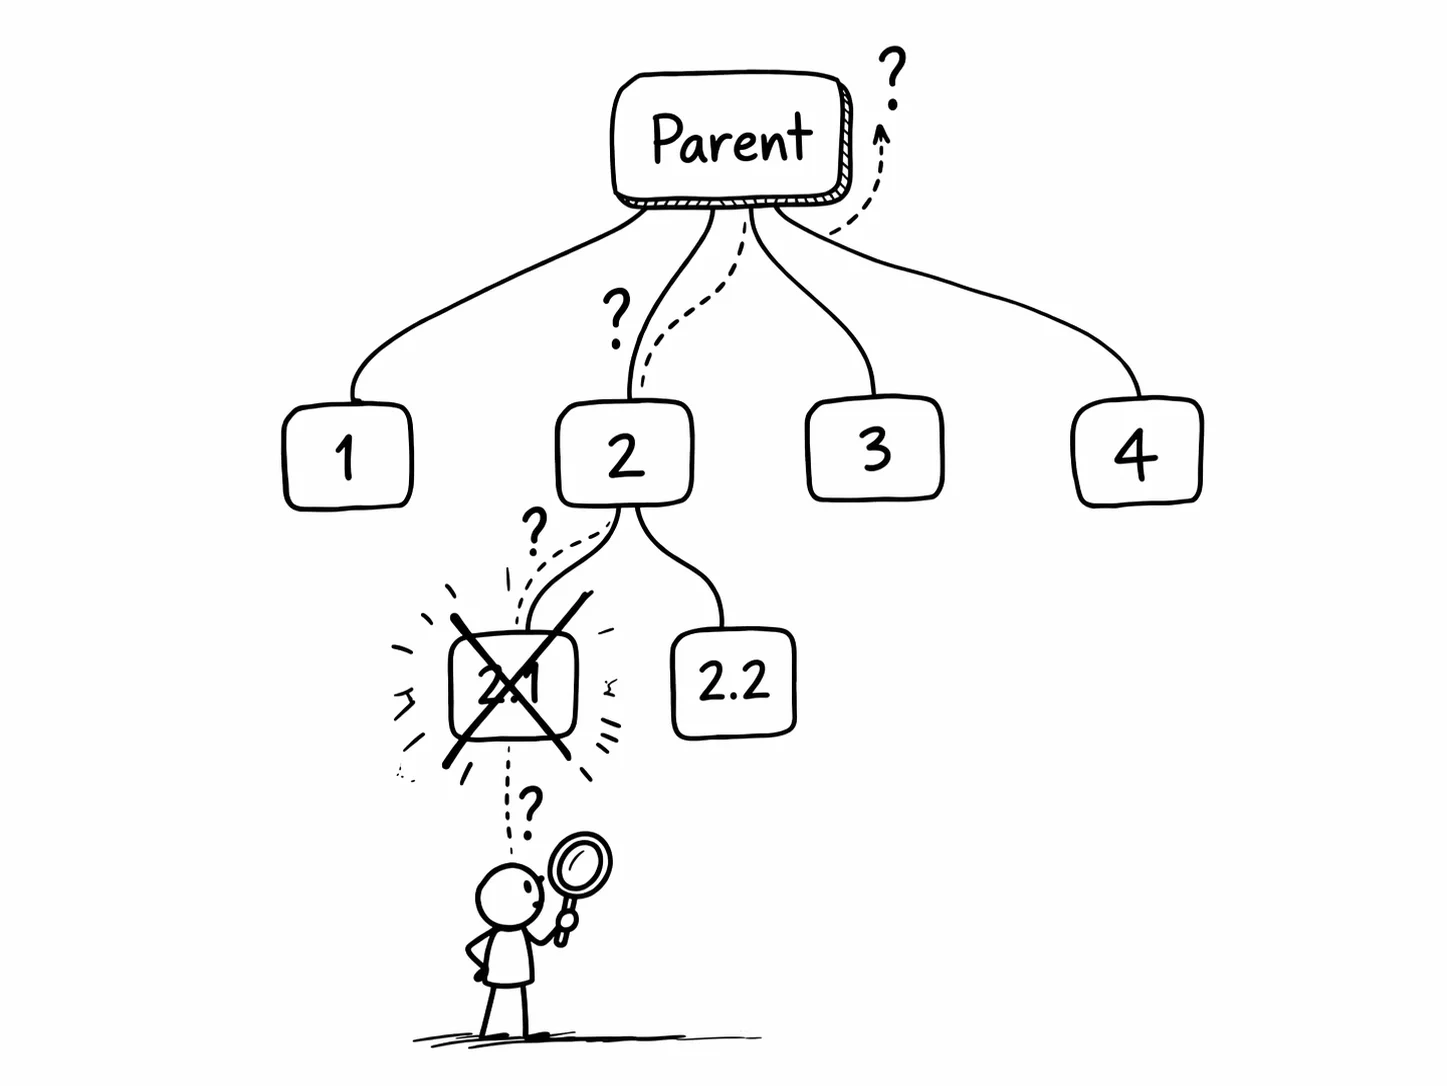
- Parent-child relationships. Which agent spawned which. What context the parent passed to the child.
- Cross-agent file dependencies. Agent 3 read a file that agent 1 wrote 30 seconds earlier. At the LLM layer, these look like two independent file reads.
- System-level activity between tool calls. The bash commands, the retries, the error recovery that burned 40% of the session.
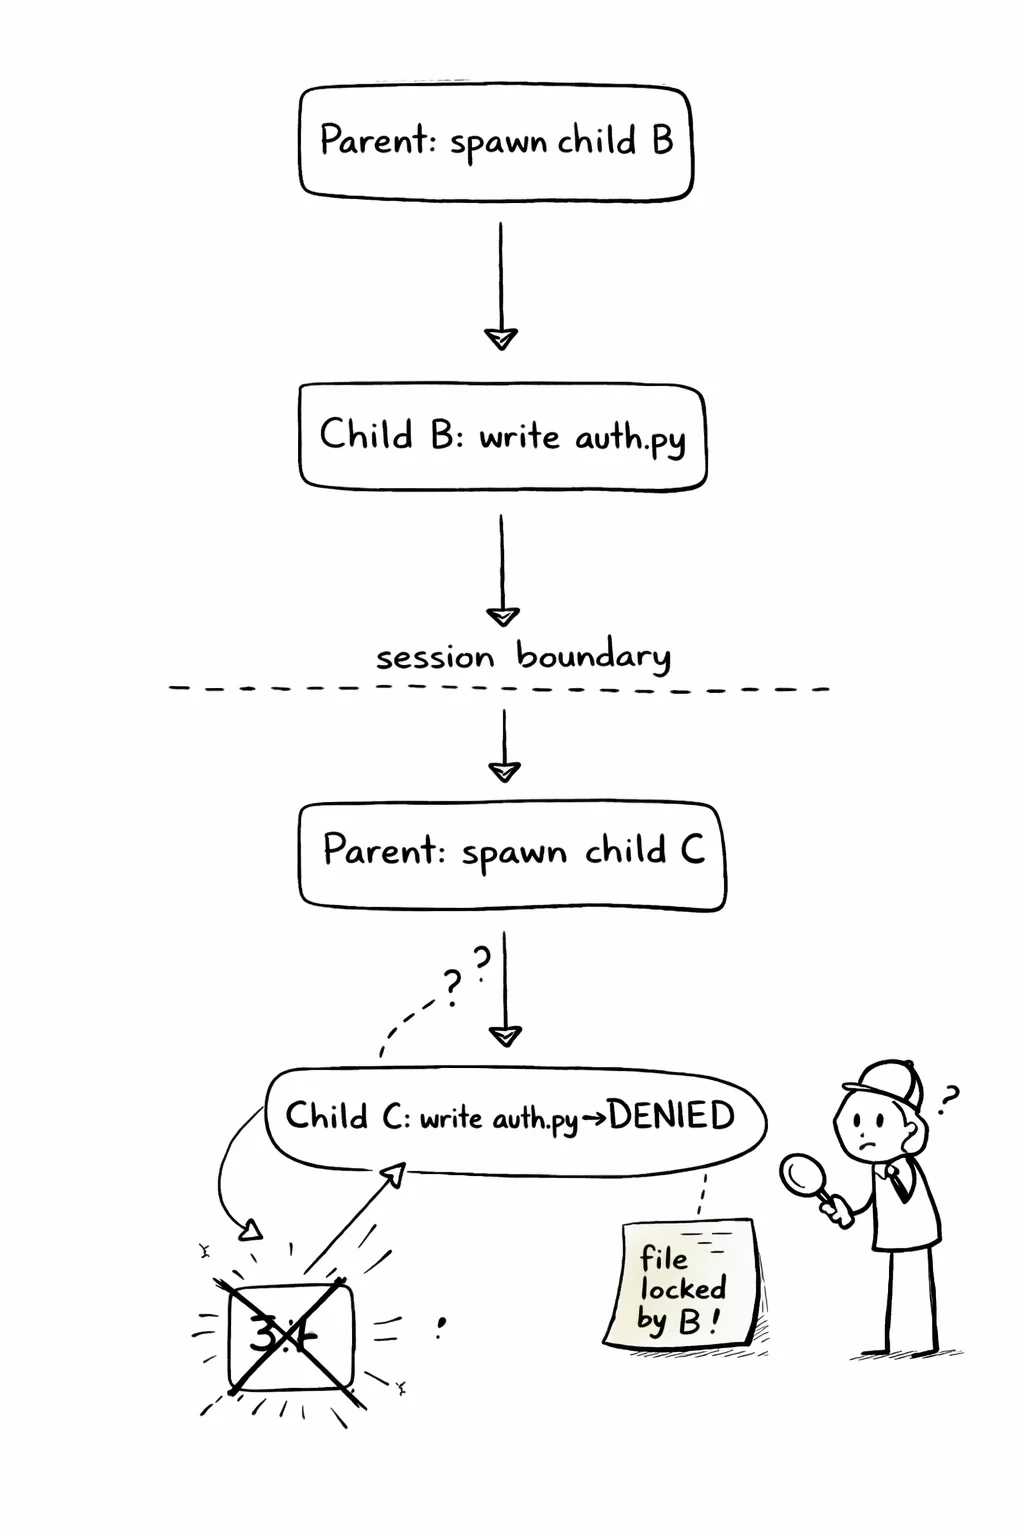
- Cascading failures. Agent 4 failed because agent 2 corrupted a config file. The LLM trace shows agent 4's failure. The system trace shows the cause.
Both pieces matter. The dashboard helps you optimize cost. The system trace helps you find the bug. Spotify learned this: their Honk verification loop needs both the LLM-as-judge and the deterministic verifiers. Both layers together are what make the system reliable.
Getting started
agent-trace captures the full session for Claude Code, Cursor, or any MCP client. Two commands to set up:
uv tool install agent-strace
agent-strace setup          # adds hooks for Claude Code
Your next session is automatically captured. Everything below works on the captured data.
Expanding the subagent tree
When agents spawn sub-agents, agent-strace replay --expand-subagents inlines child events under the parent tool call:
▶ session_start  a84664242afa  agent=claude-code  depth=0
  + 0.00s  👤 "refactor the auth module"
  + 1.23s  → tool_call  Agent  "extract helper functions"
│  ▶ session_start  b12345678901  agent=claude-code  depth=1
│    + 0.00s  → tool_call  Read  src/auth.py
│    + 0.12s  ← tool_result
│    + 0.45s  → tool_call  Write  src/auth_helpers.py
│    + 0.51s  ■ session_end
  + 3.10s  ← tool_result
  + 3.20s  ■ session_end
The indentation shows the tree. The parent spawned a child at depth 1. The child read a file, wrote a file, and finished. When something breaks three levels deep, you see exactly where.
For a quick overview of a large fleet, agent-strace replay --tree collapses each session to one line: session ID, duration, tool count, error count. You scan for the branch that took the longest or had the most errors.
Aggregate stats across the tree
agent-strace stats --include-subagents rolls up the full tree:
Session tree: a84664242afa
──────────────────────────────────────────────────
  Total sessions:   5 (1 parent + 4 children)
  Total duration:   4m 32s
  Total tool calls: 47
  Total errors:     3
  Total tokens:     84,291 (input: 71,002 / output: 13,289)
  Estimated cost:   $1.24

  Hotspot: child c34567890123 (2m 11s, 19 tool calls, 2 errors)
The hotspot line points you to the child that burned the most time. Start there.
Tracing cross-agent failures
This is where system-level tracing earns its keep. agent-strace why traces a failure back through the tree:
agent-strace why a84664242afa 31
Why did event #31 happen?

  # 31  error: Write  src/auth.py  "Permission denied"

Causal chain (root → target):

    #  5  tool_call: Agent  "extract helper functions"
       (parent spawned child b12345678901)
  ←  # 14  tool_call: Write  src/auth.py  (child wrote file)
  ←  # 22  tool_call: Agent  "update imports"
       (parent spawned child c34567890123)
  ←  # 31  error: Write  src/auth.py  "Permission denied"
       (child c tried to write file still locked by child b)
The failure in child c was caused by child b holding a write lock. The parent spawned both children to work on the same file. This is a system-level dependency that lives below the LLM layer. The causal chain crosses three sessions. In a 200-event session, reading the raw log would take an hour. why takes a second.
Auditing at fleet scale
When an agent fleet touches 200 files across 12 repos, who changed what? agent-strace audit checks every tool call (including all sub-agents) against a policy file:
AUDIT: Session a84664242afa (47 events, 23 tool calls, 4 sub-sessions)

✅ Allowed (19):
  Read src/auth.py
  Ran: uv run pytest

⚠️  No policy (2):
  Read README.md

❌ Violations (2):
  Read .env  ← denied by files.read.deny  [child c34567890123, event #18]
  Ran: curl https://example.com  ← denied by commands.deny  [child d45678901234, event #27]
Violations include the child session ID and event number. The command exits with code 1. Drop it in CI:
agent-strace audit --policy .agent-scope.json || exit 1
Every agent PR gets checked before merge.
Both layers, one picture
The dashboard tells you the fleet cost $47 and took 12 minutes. The trace tells you why child agent 3 burned half that time retrying a locked file. One helps you budget. The other helps you debug.
A fleet of 50 agents producing 200 file changes is not 50 independent problems. It is a tree of dependencies, shared state, and cascading failures. You debug it the way you debug any complex system: you trace what happened, in order, at the system level, across process boundaries.
agent-trace captures the system layer. It replays across sub-agent trees. It audits against policy. It exports to your existing observability stack via OpenTelemetry, so the system traces sit alongside your LLM traces in the same dashboard.
The industry is building agent fleets. The observability stack needs both layers.