The compiled run's 12 complete-response latencies summed 5.816 seconds lower. It also spent 54.543 extra seconds getting ready for the first request.
That is the whole result in two lines.
The observed request-latency sum was lower. The lifecycle was longer.
I ran the same 12-request workload through eager and compiled vLLM configurations on one RTX 4090. Eager initialization took 64.600270 seconds. Compiled initialization took 119.143334 seconds. Once both were ready, the eager request latencies summed to 22.861590 seconds and the compiled request latencies summed to 17.046030 seconds.
It is tempting to divide the startup penalty by the request saving, repeat the sequence, and publish the crossing point. That arithmetic crosses at request 113.
I could not call request 113 an observed break-even.
The run stopped at request 12. The outputs differed. Their lengths differed. Correctness differed. There was one lifecycle per mode and no counterbalanced replication. Request 113 is useful as a model of one exact observed sequence. It is not an observed, causal, output-controlled, replicated, or general result.
That distinction became more useful than the headline I first wanted.
The exact setup
The model was Qwen/Qwen3-8B at revision b968826d9c46dd6066d109eabc6255188de91218. The verified inventory contained 15 files totaling 16,397,461,266 bytes under Apache-2.0.
Both cells used:
- vLLM 0.28.0;
- Python 3.12;
- PyTorch 2.13.0+cu130;
- CUDA 13.0;
- Transformers 5.15.1;
- one NVIDIA GeForce RTX 4090 with 24,564 MiB;
- driver 580.159.03;
- base image
vllm/vllm-openai:v0.28.0@sha256:2286e8533ca8b6bc777594bae30524f1426ba46ca21797524e06df6a94b06635; and - derived image
sha256:fd34de17a99d2890ed1031fd32fff4c74837bbc92df7dcb955caf610266cffb3with the recordedtyping_extensions==4.15.0overlay.
The public lifecycle records expose matching hardware fields. A separate privacy-preserving run-time attestation says both cells used the same underlying private GPU identity. The public evidence does not expose that machine identifier. A reader can verify the field match, but cannot independently reconstruct the identity claim.
The workload contained 12 requests across 2K, 8K, and 16K tiers. Each mode received the same 82,732 input tokens. Each request allowed at most 96 output tokens.
The eager cell set enforce_eager=true, compilation mode NONE, and CUDA graph mode NONE. The compiled cell set compilation mode VLLM_COMPILE and CUDA graph mode FULL_AND_PIECEWISE.
This was an ordered lifecycle comparison. It was not only a token-rate comparison.
That matters because compilation changes work before and during requests. If I compare only generation rates after both systems are ready, I discard the cost that the compiled configuration must recover. If I compare only host lifetime, I mix initialization, request work, process startup, and host-side gaps. The question decides the timer.
Cold-start debt
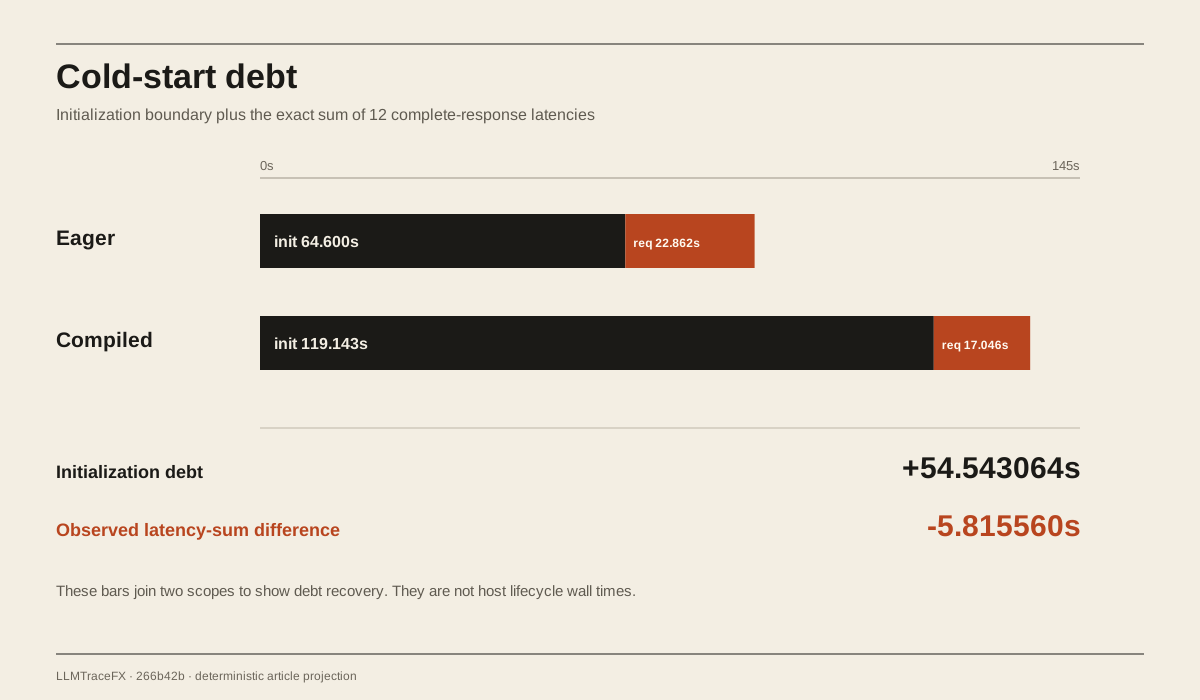
The compiled configuration began 54.543 seconds behind.
Across the 12 observed requests, it recovered 5.816 seconds by complete-response latency. Subtracting that latency saving from the initialization penalty leaves 48.727504 seconds.
The timestamp-derived initialization-to-terminal sequence leaves 48.723142 seconds at request 12. The 4.362 millisecond difference comes from the gaps around request boundaries. Figure 1 uses latency sums. Figure 2 uses the retained initialization-to-terminal timestamps.
There was no observed crossing.
Even the phrase "requests were faster" needs a boundary. Here it means the sum of 12 client-observed complete-response latencies was lower in the compiled cell. It does not mean every request was faster, server execution alone was faster, or equal output work finished faster.
The request-phase wall clock also favored compiled: 23.017732 seconds for eager and 17.189201 seconds for compiled. But those values are not the same as the latency sums. The wall clock includes gaps around the sequence. Adding 12 request latencies answers one question. Timing the request phase from its boundary timestamps answers another.
The full host lifecycles moved in the opposite direction: 132.292676 seconds for eager and 175.954381 seconds for compiled. Startup and host-side work kept the compiled lifecycle longer.
Why request 113 is modeled, not observed
I froze the exact first 12 initialization-to-terminal increments and repeated that sequence. Initialization occurs once. The same 12 observed outcomes then cycle unchanged.
Under that arithmetic:
- compiled remains 0.191134 seconds slower at request 112; and
- compiled becomes 0.161496 seconds faster at request 113.
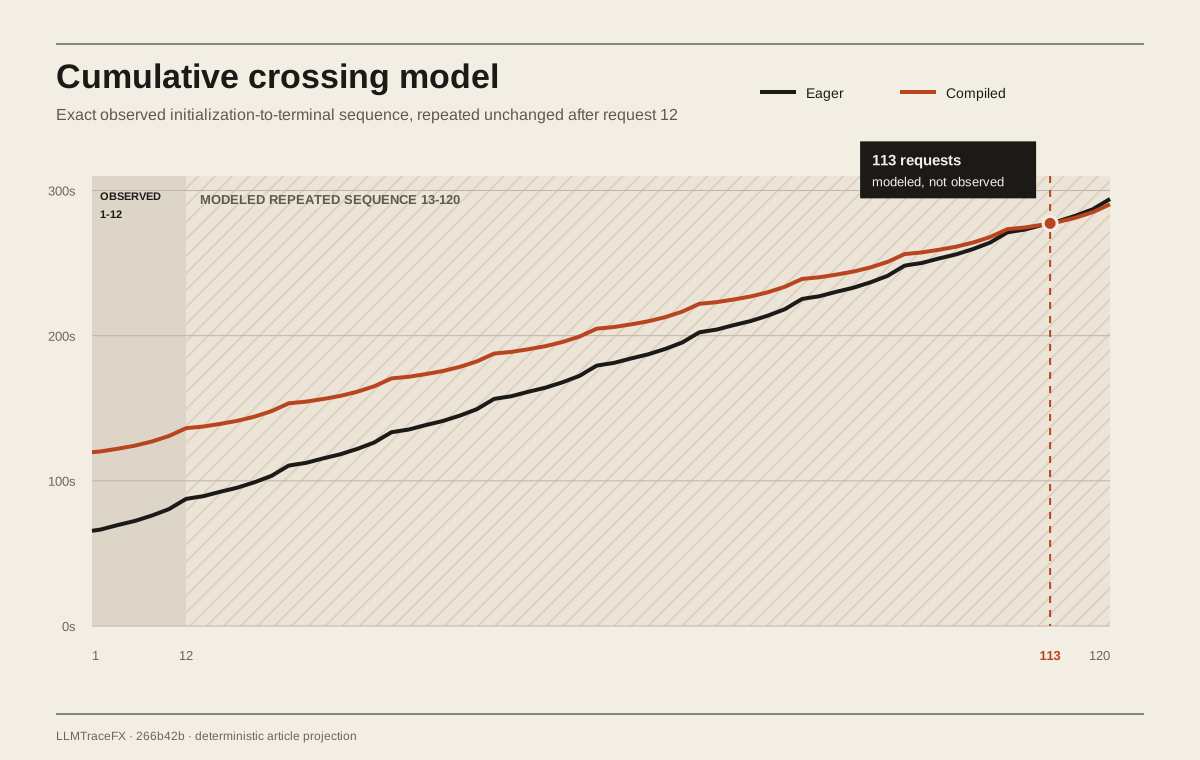
The model is useful. It converts startup debt into a concrete question: how long would this exact sequence need to repeat before the measured request-phase advantage repaid it?
But the assumptions are severe.
The 12 request outcomes must recur in the same order. Their lengths must recur. Their latency gaps must recur. The system must not warm further, cool down, reclaim memory, change kernels, hit another graph shape, encounter contention, or drift. Initialization must happen once. Nothing about request 113 was measured.
The right label is:
Modeled frozen exact-observed-outcome sequence time crossing at request 113.
That label is long because the boundary is the result.
Calling it "break-even at 113 requests" would erase the model, the frozen outcomes, and the missing controls. It would turn arithmetic into an event.
The outputs did not stay equal
The two cells received identical input-token arrays. Their outputs matched token-for-token on 8 of 12 paired requests.
They diverged at ordinals 7, 8, 11, and 12.

At ordinals 7 and 8, eager produced 38 tokens while compiled produced 44. Both outputs passed.
At ordinals 11 and 12, eager produced 62 tokens and failed the exact answer evaluator. Compiled produced 65 tokens and passed.
The totals were 426 eager output tokens and 444 compiled output tokens. Eager passed 10 of 12. Compiled passed 12 of 12. Across both cells, 22 of 24 responses passed.
This blocks a causal latency claim.
Complete-response latency includes the work needed to produce the response. When output token arrays and lengths differ, the timed work differs. A shorter latency can come from compilation, from a different output path, from fewer generated tokens, or from interactions among those effects. Here the compiled cell produced more tokens overall and still had a lower latency sum, which is interesting. It still does not isolate compilation.
Correctness adds another problem. The eager failures at 11 and 12 mean I should not treat all 24 responses as interchangeable successful work. A performance comparison needs an eligibility rule for output identity or quality, not a note added after the chart.
Measurement scopes are not interchangeable
The bundle retains several timing and outcome scopes. Each answers a different question.
| Scope | Eager | Compiled | What it means |
|---|---|---|---|
| Initialization | 64.600270s | 119.143334s | Client-observed process initialization until ready |
| TTFT sum | 9.218718s | 9.237278s | Sum of time to first token across 12 requests |
| Request-latency sum | 22.861590s | 17.046030s | Sum of complete-response latency |
| Request-phase wall | 23.017732s | 17.189201s | Wall time around the ordered request phase |
| Host lifecycle | 132.292676s | 175.954381s | Host invocation start through lifecycle end |
| Mean per-request output rate | 19.790422 tok/s | 29.751172 tok/s | Arithmetic mean of per-request output rates |
| Peak sampled GPU memory | 23,707 MiB | 21,951 MiB | Highest retained nvidia-smi used-memory sample |
| Correct responses | 10/12 | 12/12 | Deterministic workload evaluator result |
TTFT was almost unchanged in aggregate. The eager sum was 9.218718 seconds. The compiled sum was 9.237278 seconds. That does not conflict with lower complete-response latency. First-token and full-response timers cover different parts of generation.
Output rate was higher in the compiled cell, but mean per-request output rate is not lifecycle throughput. It ignores initialization and averages ratios across requests with different lengths.
Peak sampled memory was lower in the compiled cell: 21,951 MiB versus 23,707 MiB. That is a retained sample maximum, not allocator attribution or a proof that compilation always reduces memory.
Compilation and CUDA graph component durations remain null. Stable component timing was not retained. They are not zero. I can observe a longer initialization boundary. I cannot split that boundary into trustworthy compile and graph-capture components.
Cost has its own scope. The user-observed CloudRift console rate was $0.39 per hour. The boot-to-console-termination list-rate lower bound was $0.484358. Provider-reported spend is null, and provisioning-to-boot time was unavailable. The lower bound is not a bill.
Cleanup completed before a scheduled operating-system shutdown. Console termination was externally user-confirmed. Neither shutdown nor the provider event was independently provider-verified by the public bundle.
What I learned
I expected the hard part to be timing compilation. The hard part was deciding which sentence the evidence could support.
The request sequence favored compiled on complete-response latency, request-phase wall time, output rate, correctness count, and sampled peak memory. That is a useful observation.
But a useful observation can carry several incompatible stories:
- compilation made equivalent requests faster;
- compilation changed execution enough to change outputs;
- the compiled cell happened to receive a better sequence of generated work;
- the eager cell failed two evaluations and should not share one performance denominator; or
- some mix of all four happened.
This run cannot separate them.
The modeled crossing helped because it exposed what another run must control. It did not graduate into a headline just because the arithmetic returned an integer.
A practical crossover checklist
The next protocol should make the comparison harder to misread.
- Run two lanes. Use a fixed-token-count lane to equalize output work and a natural-output lane to preserve real stopping behavior.
- Start fresh lifecycles. Treat each eager or compiled cell as a new lifecycle with the same image, model, workload, and cleanup contract.
- Counterbalance order. Alternate eager-first and compiled-first pairs so order does not belong to one mode.
- Infer on lifecycle pairs. Keep request measurements, but estimate the crossover from replicated paired lifecycles rather than one sequence.
- Gate output identity and correctness. Decide before the run which responses qualify for latency comparison.
- Do not adapt retries. Predeclare failures, timeouts, and retry behavior. A slow or wrong cell must not earn extra attempts because it looks inconvenient.
- Retain component timing or keep it null. Do not subtract guessed compilation or graph-capture time from initialization.
- Condition claims on the provider. Image startup, cache state, GPU assignment, and billing boundaries belong in the result.
- Observe the crossing. Run far enough to see cumulative lifecycle time cross under the declared eligibility rules.
- Replicate past it. A single crossing can still be noise. Keep measuring beyond the first sign change.
This is a practical design for the next run, not a report of completed follow-up work.
What this evidence does not prove
This evidence does not prove:
- a general vLLM compilation break-even;
- an observed crossing after 12 requests;
- an output-controlled or causal compilation speedup;
- that request 113 will cross on a fresh lifecycle;
- that compiled output is generally more correct;
- that compilation or CUDA graph capture consumed any specific number of seconds;
- provider-reported spend;
- independent reconstruction of the private GPU identity;
- independent provider verification of shutdown or console termination;
- production readiness, an SLA, power, energy, or bandwidth; or
- a ranking against the local Qwen3-8B MLX control, which used a different runtime, checkpoint path, and hardware scope.
The evidence does support a narrower statement: in this one ordered comparison, the compiled configuration had a lower 12-request complete-response latency sum and a much larger initialization boundary. Repeating the exact observed sequence crosses in modeled cumulative time at request 113, under assumptions the run did not test.
Conclusion
The compiled configuration's observed complete-response latency sum was lower. Its observed lifecycle was longer.
The number 113 still matters. It tells me where to aim the next measurement. It does not tell me what already happened.
That is the engineering lesson I want to keep: a model can guide the next run without being promoted into the result of the last one.
Evidence: LLMTraceFX · Merged PR #61 · Exact commit 266b42b · Canonical evidence directory · Evidence catalog entry