You step away from a coding agent for an hour. On one public trace, your next request finds 18% of its input cached.
During the tool loop, the same trace finds 97%.
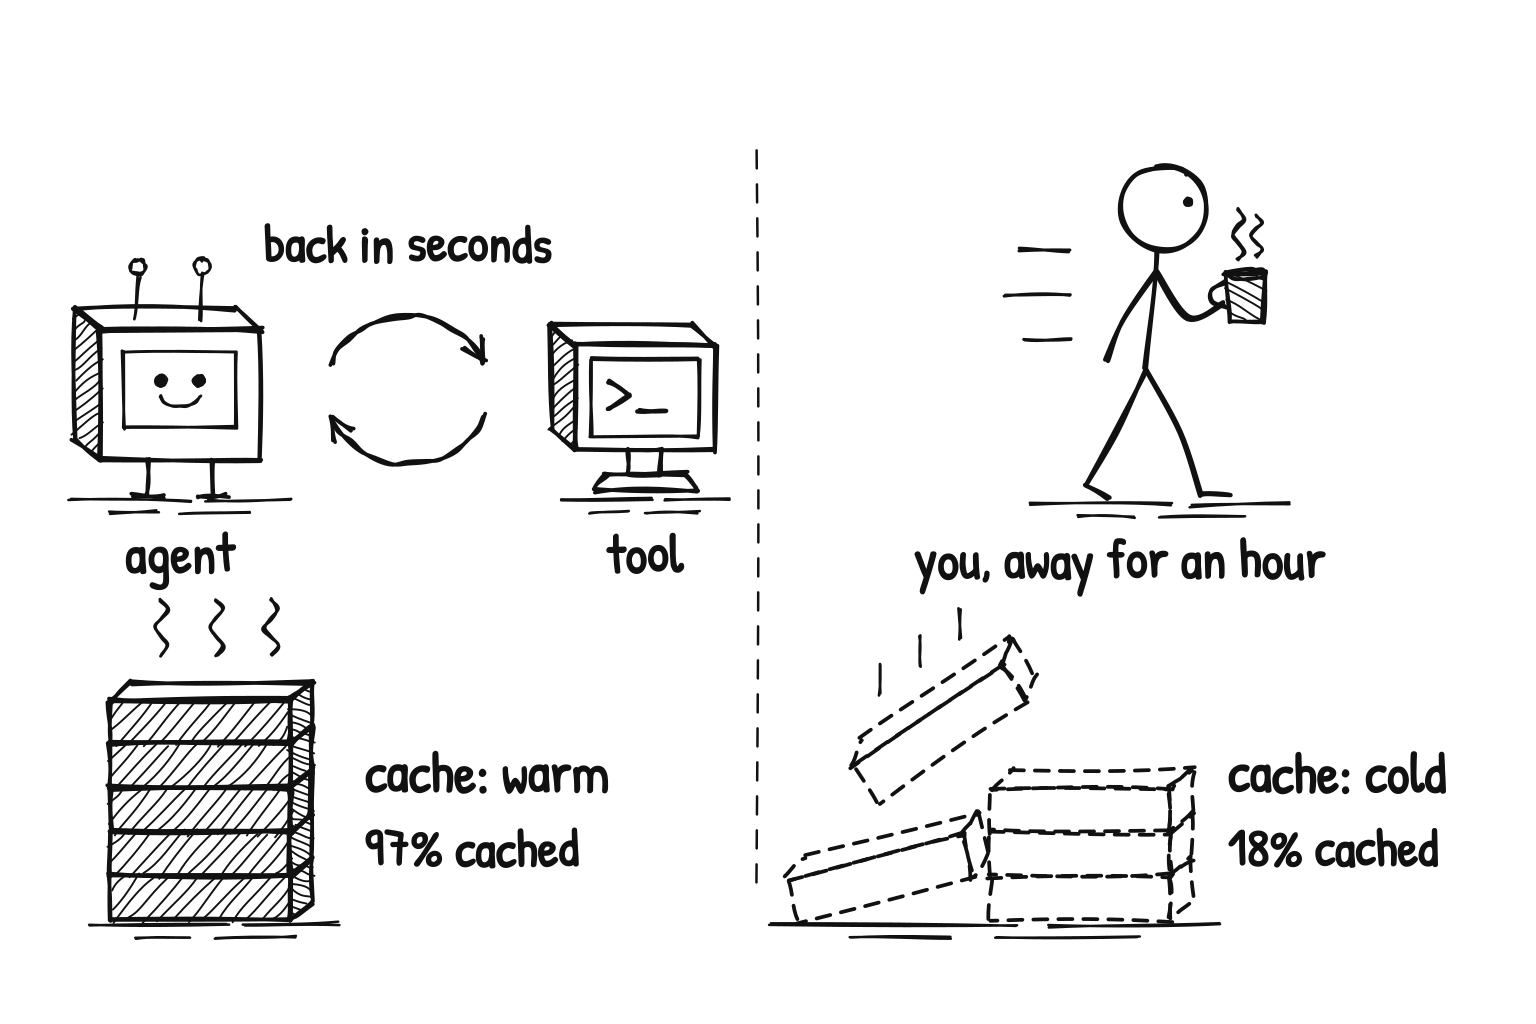
That gap matters. On every turn, a coding agent sends the model its whole conversation again. The server can reuse the work it already did on the part it has seen. When it cannot, it does that work again, and you pay in GPU time, money and waiting.
The trace comes from FreeInference, a free inference gateway run by Harvard researchers. Their October 6 paper covers 12,002 sessions from users who consented to research use (paper).
The paper also replays that traffic under different cache lifetimes. SWE-bench runs, where agents solve coding tasks with no person involved, need about five minutes of retention to keep nearly all their reuse. Human-driven sessions need about a day (sim, in paper).
Many public agent-serving benchmarks replay runs like those SWE-bench ones, with no human in them. They measure the tool loop. The misses that remain sit in the pauses, and public measurement thins out there.
This post maps the public work as of 18 October 2026: what each source measured, how, and where the measurement stops. It runs no new experiments.
A few terms, in plain words:
- KV cache: the work a model server has already done on a prompt, kept in memory so the next turn can skip it.
- Prefix: the start of a prompt that stays the same from turn to turn. Only a matching prefix can reuse the cache.
- Hit rate or hit ratio: the share of a prompt served from the cache.
- Prefill: the server reading the part of the prompt that is not cached. Every miss adds prefill.
- TTL (time to live): how long an idle cache is kept before it is thrown away.
- Harness: the app that runs the agent loop, such as Claude Code, Codex or Copilot.
- TTFT: time to first token, the wait before the reply starts.
Evidence labels: every number carries one.
- vendor means the team that builds or benchmarks the system published it.
- paper means an arXiv preprint unless marked peer-reviewed.
- sim means a simulator or cache replay, not a live system.
- blog means one person or a small team.
- status means the state of an issue, PR or dataset on 18 October 2026.
- vendor-authored means a study of the author's own product.
Sentences that start with "My read" or "I found no" are my interpretation.
Disclosure: I build small open tools for tracing and measuring inference, including agent-trace, LLMTraceFX and a KV-cache truth auditor. None of them measures the gaps in this post.
Two ways to lose the cache
Agents lose the cache in two ways. Public benchmarks mostly test one of them.
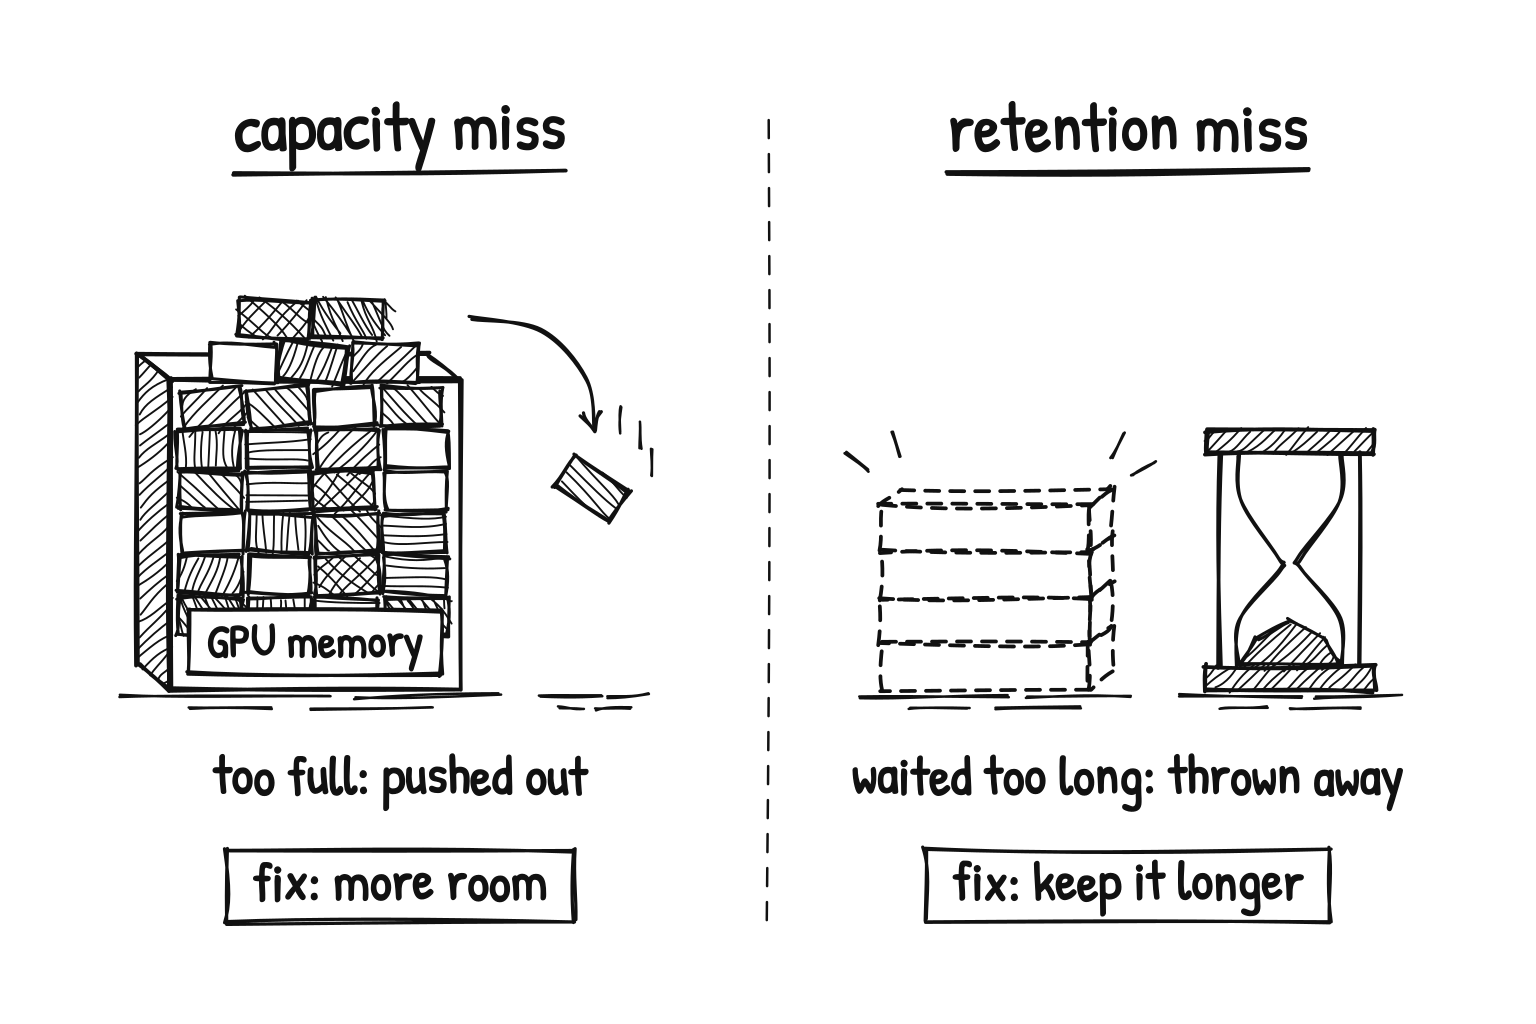
Too full: capacity misses
Inside the tool loop, the agent comes back within seconds, so most of its prompt is still cached. Between ordinary tool calls, prefix reuse runs from 94% to 99%:
- 97.5% mean hit ratio after ordinary tool gaps (paper: FreeInference).
- 98.6% of input served from an ideal prefix cache across 600 trajectories (sim, in paper: TurnCost).
- 95.7% of input tokens from cache (blog: Lumiere).
- 94.2% hit on 610 Codex runs (vendor: vLLM × Mooncake).
- About 0.97 measured on a coding-agent trace, matching the offline upper bound (vendor: TensorRT-LLM tech blog 27).
The loop misses that sources do measure come from a full memory pool.
TensorRT-LLM shows a "KV-cache eviction cliff". As more sessions run at once and the pool overflows, the hit rate on its coding trace falls toward 0.73 (vendor).
A replay of AgentX and Mooncake traces found that a 5-minute TTL "never fired" under capacity pressure. Its verdict: "capacity, not liveness" (sim, in a blog: agentic-kv-cache). In other words, memory filled up before the timer ran out.
Waited too long: retention misses
These misses happen when the session stops: you read a diff, answer the agent's question, or go to lunch. Fewer sources measure them.
- Provider-side trace. In FreeInference, user idle causes more misses than any other pause. The hit ratio falls to about 58% for gaps of 15 to 30 minutes, and to 18% beyond an hour. The mean hit ratio is 97% after tool gaps, 92% after Ask User calls (the agent asks you something), 91% after subagents and 84% after user idle (paper).
- Upstream providers differ. In the same trace, one provider holds a high hit ratio near the one-hour mark. Another drops below a 50% median hit after 15 minutes (paper).
- Retention replay. At a 15-minute TTL, human-driven sessions prefill 60.9% more tokens than they would if the cache never expired. In the authors' words, "benchmark-only evaluations therefore substantially understate the retention requirements observed in production" (sim, in paper).
- Production telemetry. In one week of GitHub Copilot coding-agent traffic, KV hit rates average 90% within a turn and 55% across turn boundaries. Model switches and context compaction, where the harness shrinks old context into a summary, "drastically" invalidate the cache (paper, vendor-authored: Microsoft Azure Research, Agentic Coding in the Wild). The authors plan to release the traces.
- Smaller sources agree. Lumiere's analysis of the TraceLab trace finds that misses cluster on the first call after an idle gap (blog). The TraceLab authors list "KV-cache management around human-paced gaps" as an open opportunity (paper: TraceLab).
Two problems, two kinds of fix. Capacity misses respond to more memory (offload tiers), eviction policy and routing. Retention misses respond to keeping idle sessions longer (session-aware TTLs and pinning), client keepalives and hints from the harness. A benchmark win on one says little about the other.
Benchmarks test the loop, not the pause
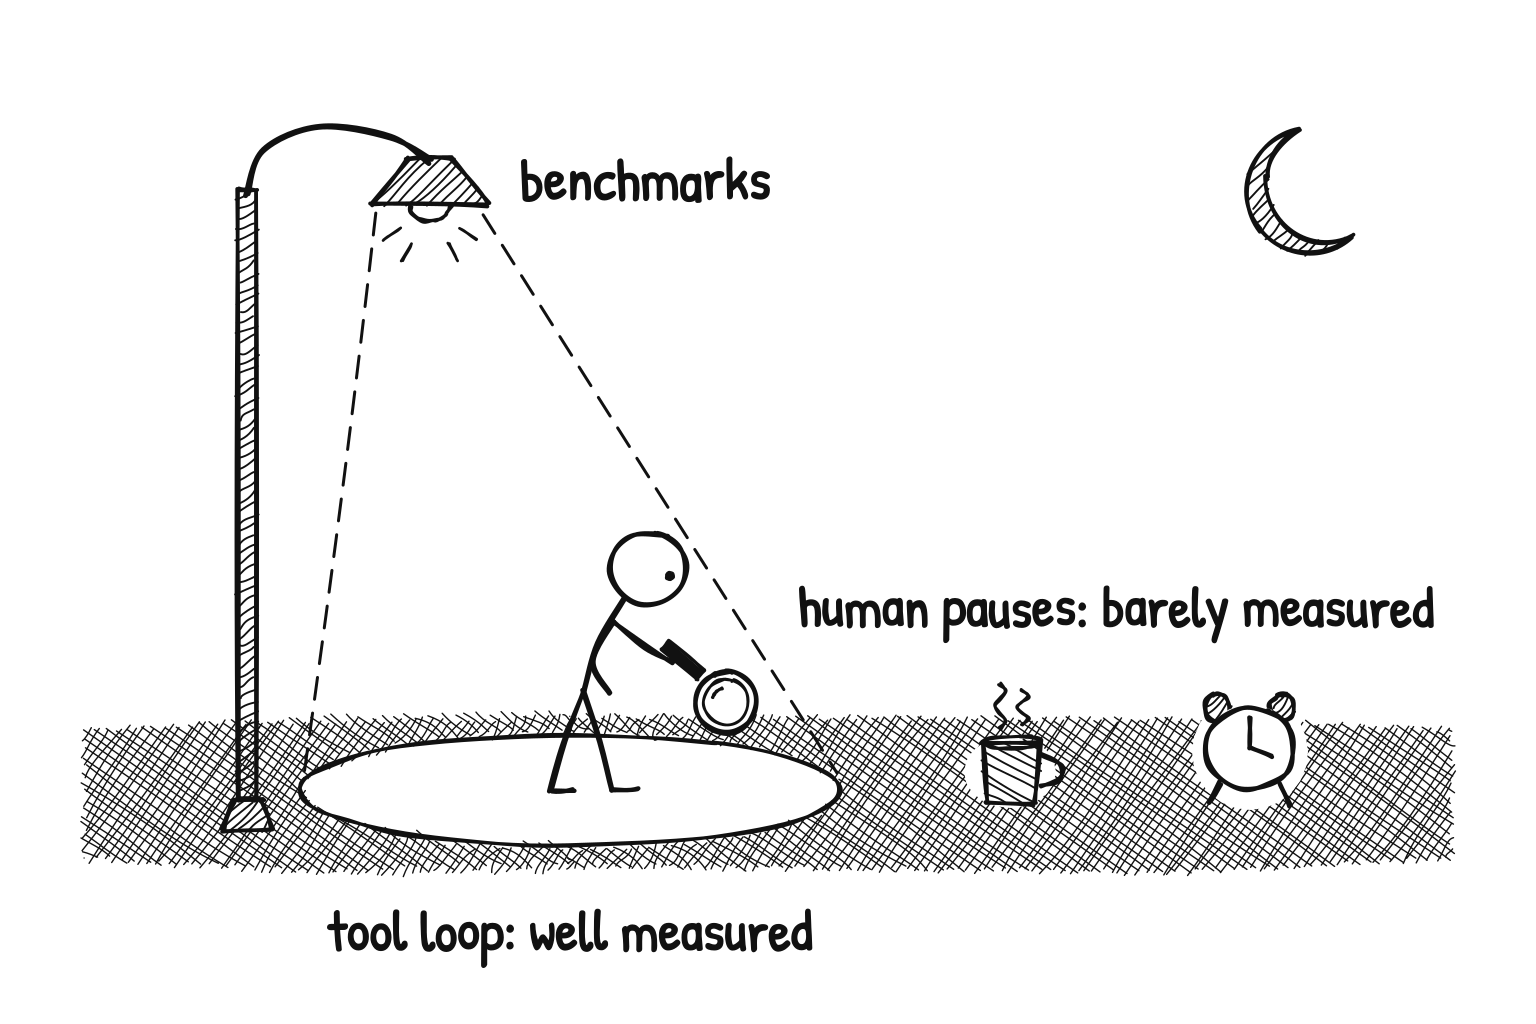
Replays built from SWE-bench or TerminalBench runs contain no human pauses. That covers vLLM × Mooncake and AgentPerfBench.
SemiAnalysis's AgentX differs. It replays recorded per-session gaps from opt-in human Claude Code sessions (vendor).
But its aiperf scenario shifts timers so that system-wide idle never exceeds 10 seconds. Its methodology seeds a warmup, then profiles a one-hour window (vendor).
My read: a one-hour window cannot show day-scale retention, so even AgentX mostly samples capacity misses. That is my inference, not a SemiAnalysis claim.
Each benchmark also fixes a different part of the job:
AgentX (InferenceX v3) strips the real prompts and refills them with synthetic text. It replays each session with its subagents and caps offload to CPU memory (DRAM) at 3 TB. It states that "synthetic payloads do not support model-quality evaluation" (vendor). Its aiperf scenario recommends a date-pinned dataset alias for comparisons (vendor).
TensorRT-LLM tech blog 27 (NVIDIA, August 2026) argues for job-level metrics: jobs per hour per user, and jobs per hour per GPU (vendor). One reason: counting reused prefix tokens reports per-GPU throughput about five times higher than counting only fresh tokens. I hit the same token-versus-job tension in my vLLM compilation break-even post.
AgentPerfBench (Imperial) argues that existing benchmarks ignore context growth and never push the hardware to its limit (paper).
AgentSysBench finds that non-LLM components dominate latency in 5 of 10 agentic applications, with sandbox working sets up to 28 GB per session (paper: AgentSysBench). FreeInference agrees from the other side: tool execution and user idle fill 72% of session time (paper).
Each of these benchmarks answers "how fast does the server go on agent-shaped traffic?" None answers "did the task finish, and what did each success cost?"
Every pause on one axis
A TTL works like a timer. Each request that uses the cache resets it. If a pause outlasts the timer, the cache is dropped, and the next request starts cold.
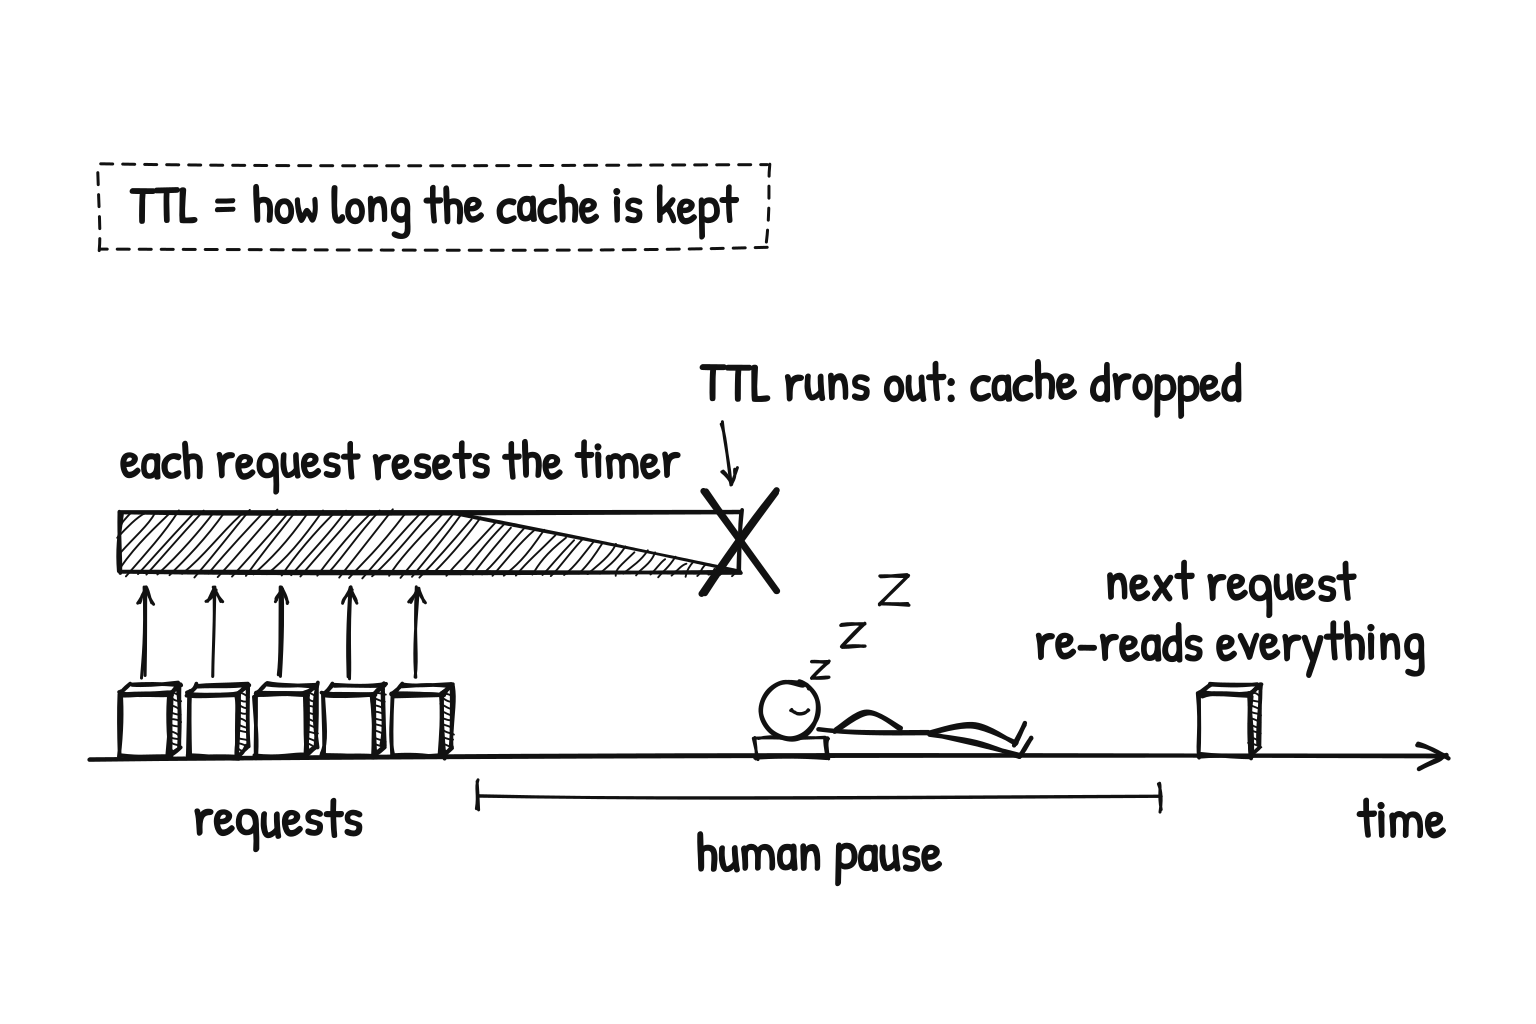
Figure 1 puts the published numbers on one log-time axis, so seconds, minutes, hours and a day fit on one line. Nothing on it is interpolated or re-measured.
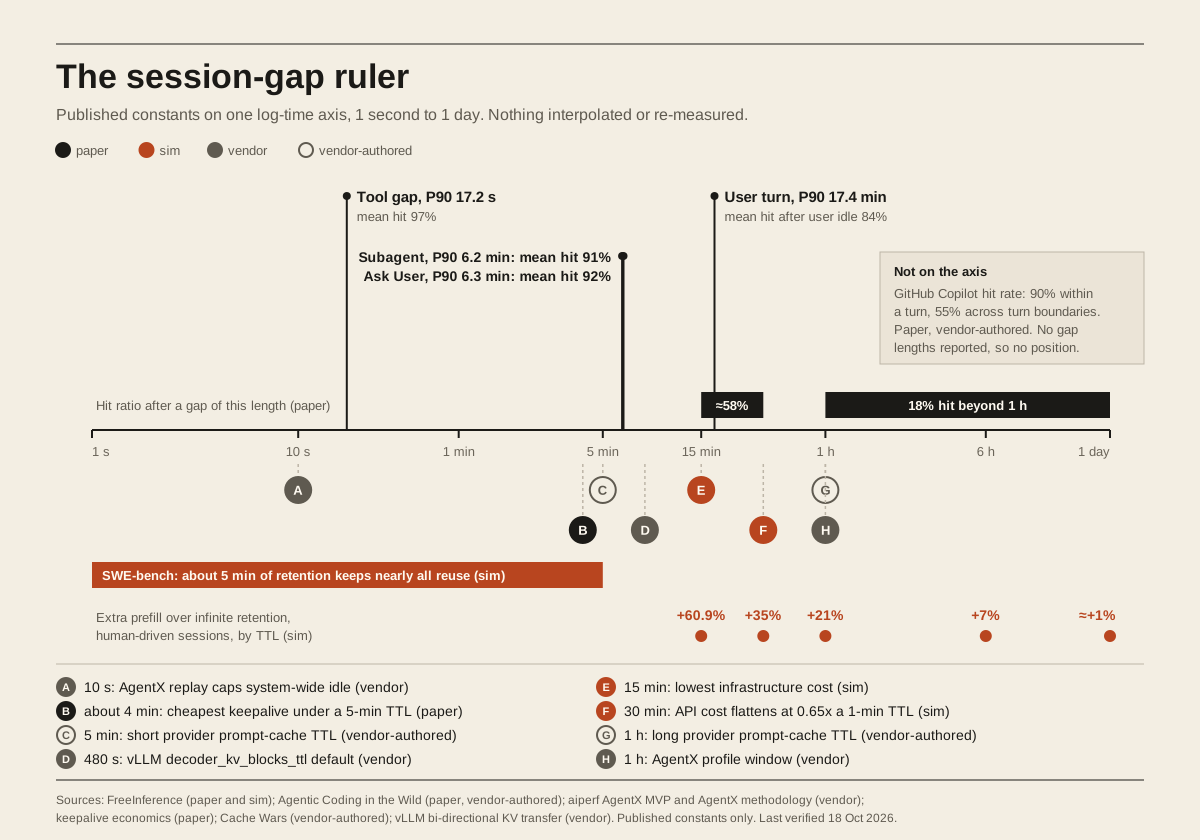
| Mark | Value | What it is | Label | Source |
|---|---|---|---|---|
| Tool gap P90 | 17.2 s | 90% of ordinary tool gaps are shorter; mean hit 97% | paper | FreeInference |
| Subagent P90 | 6.2 min | Gap while a subagent runs; mean hit 91% | paper | FreeInference |
| Ask User P90 | 6.3 min | Gap while waiting on an Ask User tool; mean hit 92% | paper | FreeInference |
| User turn P90 | 17.4 min | Gap between user turns; mean hit after user idle 84% | paper | FreeInference |
| Hit band | about 58% | Hit ratio for gaps of 15 to 30 min | paper | FreeInference |
| Hit band | 18% | Hit ratio for gaps over 1 h | paper | FreeInference |
| A | 10 s | AgentX replay caps system-wide idle at 10 s | vendor | aiperf AgentX MVP |
| B | about 4 min | Cheapest client keepalive interval under a 5-min provider TTL | paper | Keepalive economics |
| C | 5 min | Short provider prompt-cache TTL; harnesses using it kept 0% cached after a 390 s pause | vendor-authored | Cache Wars |
| D | 480 s | vLLM decoder_kv_blocks_ttl default |
vendor | vLLM bi-directional KV transfer |
| E | 15 min | Infrastructure cost is lowest at this TTL | sim | FreeInference |
| F | 30 min | API cost flattens: 0.65 times a 1-min TTL, within 4% of its minimum | sim | FreeInference |
| G | 1 h | Long provider prompt-cache TTL; 82.5 to 86.5% still cached after a 390 s pause | vendor-authored | Cache Wars |
| H | 1 h | AgentX profile window | vendor | AgentX methodology |
| Band | up to about 5 min | Retention that keeps nearly all SWE-bench reuse | sim | FreeInference |
| Prefill row | 60.9%, 35%, 21%, 7%, about 1% | Extra prefill over infinite retention at TTLs of 15 min, 30 min, 1 h, 6 h and 1 day (human-driven sessions) | sim | FreeInference |
| Side box | 90% / 55% | Copilot hit rate within a turn / across turn boundaries | paper, vendor-authored | Agentic Coding in the Wild |
The cost points rest on FreeInference's assumptions. API cost uses $10, $1 and $50 per million uncached input, cached input and output tokens. Infrastructure cost uses $1 per million recomputed tokens and $30 per million token-days of DRAM.
Whose agents are in the data
The public trace sets agree on shape: long prompts, short replies, many turns, and a growing prefix that the model re-reads every turn.
| Corpus | Who and how | What it shows | Label |
|---|---|---|---|
| AgentX cc-traces | SemiAnalysis; 393 opt-in Claude Code sessions | Median 142k input and 444 output tokens per request. 44% of sessions use subagents. The full set has 98,827 requests; the 256k variant has 68,266. Payloads are synthetic. | vendor; counts are status |
| TraceLab | University of Washington; the authors' own Claude Code and Codex use | About 4,300 sessions in the paper; 8,058 sessions from 52 users in dataset v0.0.2. High but imperfect hit rates. aiperf can replay it; inference-perf has an open request for a loader (#813). | paper; status |
| FreeInference | Harvard; provider-side, consenting users; 12 models, with most requests served by locally hosted ones | 12,002 sessions, 1.19M requests, 209B input tokens. CC BY 4.0. 13 harnesses plus a SWE-bench evaluation label. The largest by top-level sessions are Hermes (3,953), OpenCode (1,733) and Pi (1,499); Claude Code has 639, Copilot 295 and OpenHands 22. | paper; harness counts are status, from the released sessions table |
| GitHub Copilot in the wild | Microsoft Azure Research; one week of production telemetry, US only | 13M sessions, 3.2M users, 761M LLM calls, 95T tokens, 27+ models. Sparse user turns, each unfolding into an autonomous loop. An idle-time predictor captures 86 to 90% of idle time. No public dataset yet. | paper, vendor-authored |
| vLLM × Mooncake | vLLM project; 610 Codex runs on SWE-bench Pro | Median 33 turns, 94.2% hit, 131:1 input to output, context growing from 12K to 80K tokens. | vendor |
| Lumiere | Independent analysis of TraceLab | 88% of calls are tool-result continuations; compaction happens in 9.7% of sessions. | blog |
| Agentic AI Workload Characteristics | IISWC 2026 | With effective caching, execution becomes decode-dominated. Tool use shifts from reading and exploring early to executing and writing late. | paper, peer-reviewed |
Two things vary by trace set. Any claim about "a typical agent workload" needs to say which one.
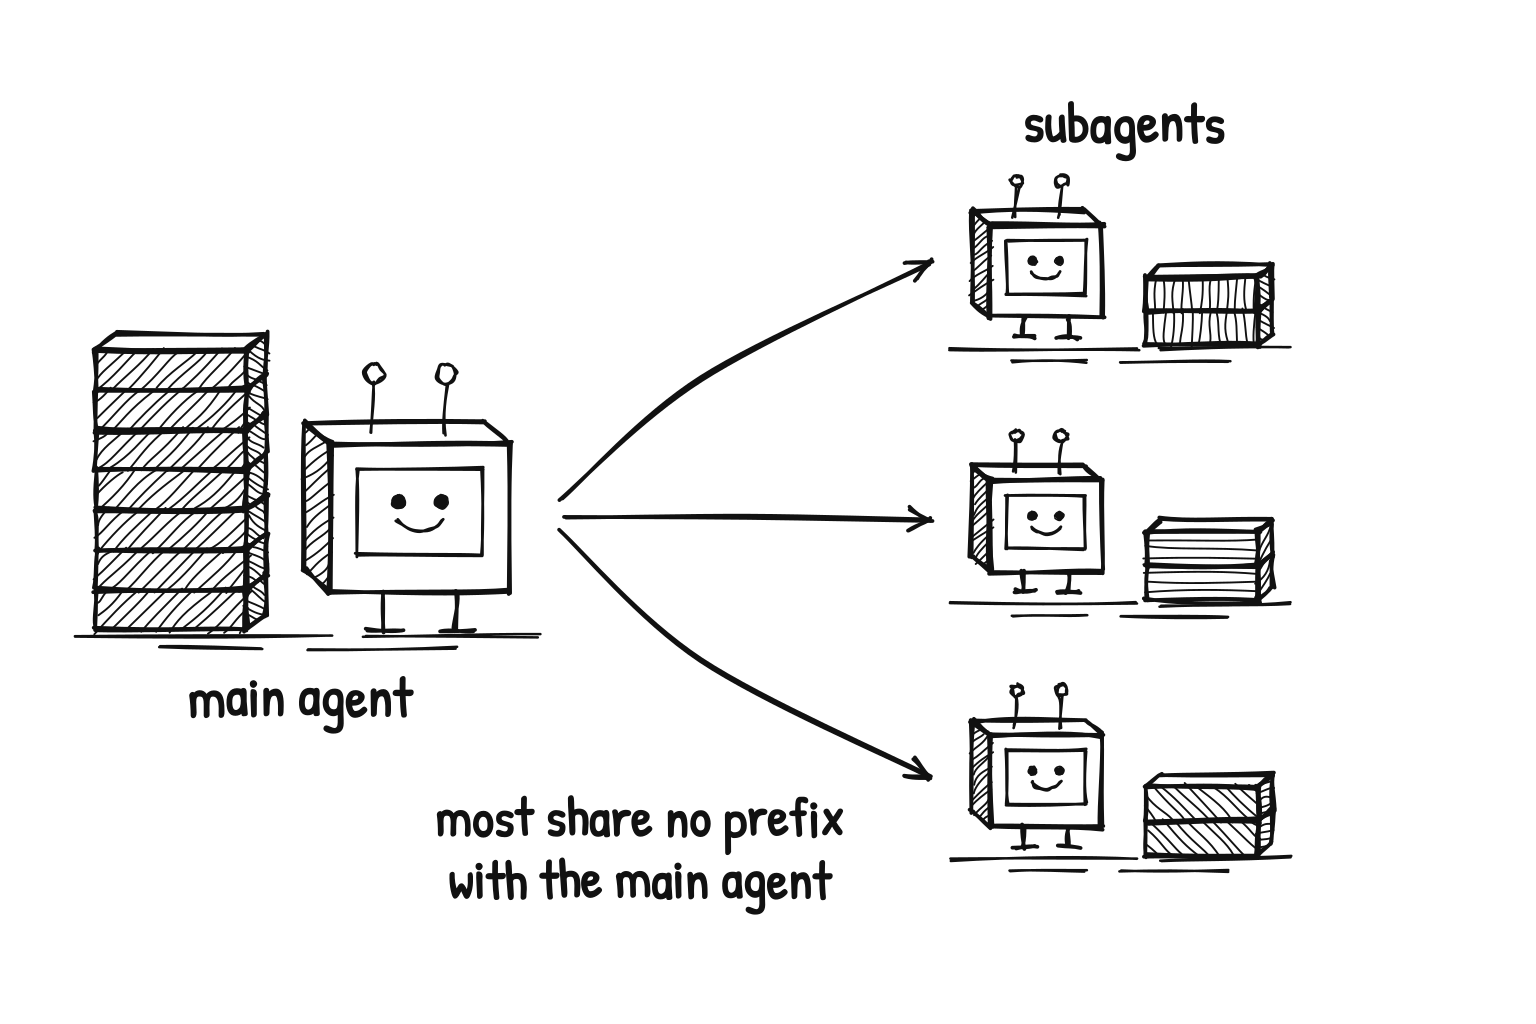
Subagent use. A subagent is a helper that the main agent starts for a side task. 44% of AgentX sessions use subagents (vendor), against 10.4% in FreeInference (paper). In the 256k cc-traces set, 58.3% of requests come from subagents, and 81.5% of subagent spawns share no prefix with the main thread (blog: Yang Li). Those spawns cannot reuse the main agent's cache.
Harness mix. AgentX is Claude Code only. The Copilot study is Copilot only. FreeInference is mostly open-source harnesses.
Who is fixing what
The work splits along the two kinds of miss. Engines and routers mostly target capacity. The harness is the layer that sees the pause.
Engines add room
Engine projects spent 2026 on capacity misses (all vendor):
- vLLM × Mooncake: hit rate from 1.7% to 92.2%, 3.8 times the throughput and 46 times lower median TTFT on its Codex traces.
- vLLM bi-directional KV transfer (October 12): up to 3.3 times lower TTFT. Its
decoder_kv_blocks_ttldefaults to 480 seconds (post). - TensorRT-LLM: offloading to host memory pushes the eviction cliff back. With the largest host budgets, the coding trace's hit rate climbs from 0.73 back to nearly its 0.97 optimum.
The agentic-kv-cache replay split the work it had to redo by gap length: 33.1% came from gaps under 10 seconds, against 17.5% from gaps over 5 minutes (sim, blog).
Routers chase the cache
A router picks which server gets each request. A prefix-aware router sends it to the server that already holds its prefix. llm-d, Dynamo and SGLang all ship one now (vendor).
Sticky until saturated is llm-d's new default. A request stays on the server that holds its prefix until that server's load passes a set limit. Then the router balances on load alone. With matched configurations, it sustains 2 to 3 times the throughput of Kubernetes round-robin on prefill-bound workloads (vendor: llm-d blog). The blog tested reasoning, B2B SaaS and code generation, not agent traces.
llm-d's Agentic Serving page calls program-aware serving, which plans around the whole agent session, "the direction" (vendor).
Affinity can backfire. CacheRoute plans prefix-affinity routing ahead of time. On 60 H100s serving Llama-3.3-70B, it reaches 2.3 times the strongest of five baselines with a 3.5-second p99 latency target, and lifts the served hit rate from 64.1% to 93.2% (paper, one author: CacheRoute). But on two 32B workloads, affinity piles load onto a few servers and shrinks or erases the gain. The paper's advice: replay your own traffic first, a shadow replay, before you turn affinity on. Its workloads are semi-synthetic, not agent sessions.
Session-aware scheduling. NVIDIA Dynamo now tags requests with a session ID. A scheduler that plans around the whole session gave 12 to 16% more throughput than cache-aware routing alone, on SWE-bench runs with prefix hits already above 94.5% (vendor: PyTorch blog). Its KvHint interface would let the router ask the engine to prefetch, pin or keep a cache. It is a proposal, and the team reports no results yet.
Harnesses see the pause
Harness choices move the bill after a pause. Read these by label:
- Cache Wars (vendor-authored by AGNT, one of the six harnesses compared): post-pause billing diverged 4.3 to 9.8 times across harnesses. After a 390-second pause, harnesses using 1-hour cache markers kept 82.5 to 86.5% cached; those using 5-minute markers kept 0% (whitepaper).
- Keepalive economics (paper, one author, 5 pages): replaying the prefix on a timer during a pause, a keepalive, cuts post-pause request cost by up to 12.5 times across Anthropic, OpenAI, Google and DeepSeek. The cheapest interval is the largest one safely under the provider's TTL: about 4 minutes for a 5-minute TTL, not the common 30 seconds (arXiv).
The HEAR protocol pairs harness and engine. It reports 1.23 and 2.45 times end-to-end gains on BrowseComp-Plus and DeepResearchBench, "without observed task-quality degradation" (paper: HEAR).
FreeInference proposes that harnesses send lifecycle hints to the server: mutation, pause, resume and end (paper).
The harness knows when a session will pause. The engine knows what it has cached. The retention problem gets solved at the interface between them, and that interface is still a proposal.
What is not measured yet
A trace is only evidence if you know what it missed. The same goes for this map.
"Not yet measured" means I found no public measurement as of 18 October 2026. It does not mean nobody has done it. If you have, tell me and I will update the table.
| Layer | Measured in public | Not yet measured | Closest work |
|---|---|---|---|
| Retention at session edges | Hit by gap length (FreeInference, paper); 90% within a turn versus 55% across turns (Copilot, paper, vendor-authored); TTL replay (FreeInference, sim); provider TTLs (Cache Wars, vendor-authored); keepalives (paper) | Retention policies under human-paced gaps on self-hosted engines with real routers; day-scale behaviour in any benchmark | KvHint pin and retain (vendor proposal); llm-d tiered offload "to keep idle sessions resident" (vendor); UNISON (paper) |
| Harness context mutations | 62% of new prefill (FreeInference, sim); invalidation after compaction and model switches (Copilot, paper, vendor-authored); invalidation triggers (Induction, blog) | Serving-side cost of compaction strategies on self-hosted engines, tied to task outcome | Empirical Harness Design measures quality and efficiency, not serving cost (paper) |
| Routing policy | Sticky until saturated, 2 to 3 times round-robin (llm-d, vendor); planned affinity with counterexamples (CacheRoute, paper); session-aware scheduling, 12 to 16% (Dynamo, vendor) | Routing policy, finite capacity and harness together on human-paced agent traces | llm-d Agentic Serving (vendor) |
| Harness to engine interface | Session headers and admission (Dynamo, vendor); HEAR speedups (paper); lifecycle hints proposed (FreeInference, paper) | Any standard; any cross-vendor evaluation | KvHint (vendor proposal) |
Limits of this map
- Synthesis, not measurement. I ran no GPUs and analysed no traces. Every number comes from someone else's setup, and the setups differ.
- "Hit rate" is not one metric. It can be token-weighted or request-weighted, theoretical or measured, provider-side or engine-side. FreeInference's 97.4% is a share of all tokens among requests that report cache usage; TurnCost's 98.6% is a share of input in an ideal cache. Check the definition before you compare.
- Corpus bias. AgentX is 393 opt-in sessions, and TraceLab is its authors' own use. FreeInference is a free gateway serving 12 models, with most requests going to locally hosted ones, and a harness mix led by Hermes, OpenCode and Pi. The Copilot study covers one week of one vendor's product in one country, and nobody can reproduce it until the traces ship.
- Dataset quirks. The cc-traces input field is hash blocks times 64, which overcounts by up to about 260k tokens in the heavy cache-write tail. The full and 256k sets differ in size.
- Vendor-authored studies. Cache Wars measures its authors' own harness, and the Copilot study characterises Microsoft's own product. vLLM, NVIDIA, llm-d and SemiAnalysis numbers are vendor numbers. I label them rather than discount them.
- Mostly preprints. TurnCost (ACM workshop) and Agentic AI Workload Characteristics (IISWC 2026) are peer-reviewed. The rest are preprints, and the FreeInference paper is a self-hosted PDF.
- No rankings. I left out per-hardware winners and cross-model cost comparisons. This is a map, not a leaderboard.
- Out of scope. RL rollouts and training, hardware choice, non-coding agents, and CPU-side agent execution.
- Snapshot. Status items will move within weeks: KvHint; the Copilot trace release; inference-perf #813.
Last verified: 18 October 2026.
What I learned
The loop is in good shape. Between tool calls, the sources above find 94% to 99% of the prompt already cached (paper, sim, blog, vendor). The misses left in the loop come from full memory, and engine teams are working on it.
The pause is where the cache goes. After an hour away, FreeInference finds 18% cached (paper). Copilot sees 55% across turns against 90% within one (paper, vendor-authored). Human-driven sessions need about a day of retention, against about five minutes for SWE-bench runs (sim, in paper).
Benchmarks look where the light is. Most replay runs with no human in them. Even AgentX, which keeps human gaps, caps system-wide idle at 10 seconds and profiles one hour (vendor).
The fix sits between harness and engine. The harness knows a pause is coming. The engine knows what it holds. The hints that would connect them are still proposals.
If you run agents
Each practice traces to a cited source:
- Report hit rate by gap type, not as one aggregate. A 95% average can hide 84% after user idle (FreeInference, paper).
- Report job-level metrics next to token-level ones (TensorRT-LLM, vendor).
- Name your trace set and pin its version before you compare numbers (aiperf, vendor).
- Measure cost per successful task, not tokens (Prompt-Induced Waste, paper).
- Treat compaction and model switches as cache events (FreeInference, sim; Copilot, paper, vendor-authored; Induction, blog).
- Shadow-replay your own traffic before you turn on prefix affinity (CacheRoute, paper).
- If you pay a provider, set the keepalive interval to the largest value safely under its TTL, not a fixed 30 seconds (keepalive economics, paper).
What I would measure next
The gaps table points to three tests:
- Replay a human-paced trace, real gaps included, on a self-hosted engine behind a real router. Report hit rate by gap length and TTL. TraceLab already replays in aiperf, and the FreeInference trace is public.
- Compare TTLs by cost per successful task, not by tokens per second.
- Measure what compaction costs the server, next to whether the task still finished.
The agent will wait for you
A tool call comes back in 17.2 seconds at the 90th percentile. A person comes back in 17.4 minutes (paper: FreeInference).
The agent waits either way. It keeps its context, its plan and its place in the task.
The server decides whether the cache waits too. I found no public serving benchmark that tests that decision across a lunch break.