Leave a coding agent idle for four and a half minutes, and about 60% of its next prompt is still cached. Wait 30 seconds more, and 26% is.
That is the public GitHub Copilot coding-agent trace, sorted by the idle time before each call. In Your coding agent loses its cache while it waits for you, I quoted the paper behind this trace. Its idle-time figure puts 2 to 10 minutes in one bin, with a median near 70% (paper). That bin hides the edge, so I ran the trace myself.
On most of this traffic, the cache falls off a cliff at 5 minutes. It does not matter whether you paused or a tool did. The pooled average says about 20% stays cached after 5 minutes. Most of that 20% comes from a few models with no cliff at all.
Every number below is my measurement on the full release unless marked (paper). "Cached share" is token-weighted: cached prompt tokens over all prompt tokens in a bin, not an average of per-call rates. Brackets hold 95% confidence intervals.
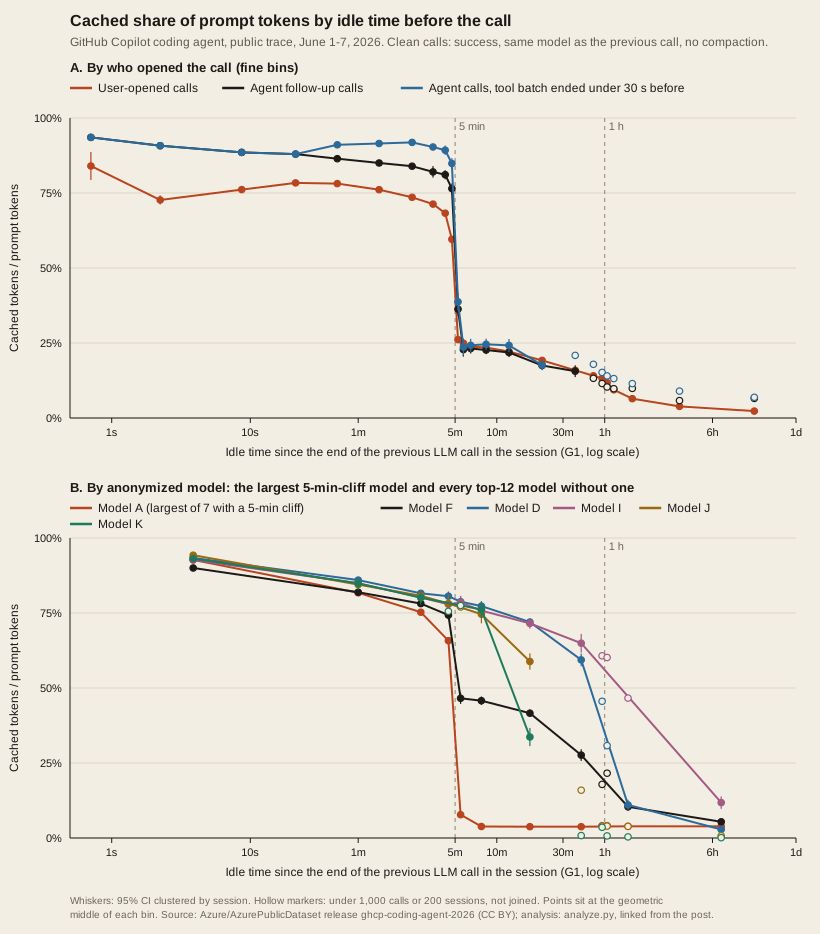
The cliff sits at 300 seconds
"User-opened" calls start a turn after a person sends a message. "Agent" calls are the follow-ups the agent makes on its own. "Agent after a tool" calls are agent calls that start under 30 seconds after a tool batch ends, so a tool filled most of the gap.
| Idle before the call | User-opened | Agent | Agent after a tool |
|---|---|---|---|
| 180-240 s | 71.3 [70.8, 71.9] | 82.0 [80.1, 84.0] | 90.3 [89.5, 91.2] |
| 240-270 s | 68.3 [67.4, 69.1] | 81.1 [79.6, 82.6] | 89.3 [87.7, 90.8] |
| 270-300 s | 59.6 [58.7, 60.5] | 76.5 [74.8, 78.2] | 84.8 [83.1, 86.6] |
| 300-330 s | 26.1 [25.2, 27.1] | 36.3 [34.1, 38.5] | 38.7 [35.8, 41.6] |
| 330-360 s | 24.9 [24.0, 25.9] | 22.8 [20.5, 25.1] | 23.6 [20.8, 26.5] |
| 360-420 s | 23.8 [23.0, 24.6] | 23.2 [21.5, 24.8] | 24.2 [22.0, 26.4] |
Across 300 seconds, user-opened calls lose about 33 points and agent calls about 40. The intervals on either side do not overlap, and each of those four cells holds at least 3,378 calls.
The slide starts in the 270-300 s bin, 8.7 points down for user-opened calls. I did not test why. Client clocks, 10-second rounding on some timestamps, or a retention clock that starts before the previous call ends could each blur the edge.
The edge is consistent with a documented 5-minute retention, the short provider TTL on the field guide's ruler. The trace goes no further. It cannot tell an expired cache from a request routed to a replica without the prefix, or from eviction under memory pressure.
A tool wait costs the same as yours
The field guide framed the loss as the agent waiting for you. The trace says the wait matters, not who caused it.
21,398 agent calls came 5 minutes or more after the previous LLM call, but under 30 seconds after a tool batch ended. The agent opened these calls, not a person. Calls of this kind fall at 5 minutes like user-opened calls: 87.4% cached at 4-5 minutes, then 32.5% at 5-6 minutes and 20.3% at 10-30 minutes. User-opened calls show 25.6% and 20.5% in the same two bins.
From 330 seconds to 30 minutes, their intervals overlap the user-opened intervals in every fine bin, and their shares sit within 3 points. Past 5 minutes, the one bin where they differ is 300-330 s: 38.7% against 26.1%.
The trace cannot say whether that tool time was a command running or a person deciding whether to approve one. Its auto_continue field does not mark approval waits. Either way, the provider saw no call for 5 minutes or more. That points at elapsed time, not the turn boundary, as what costs the cache. It does not prove it. Long gaps come from different sessions and moments, so these are associations.
The 20% average is two kinds of model
The release hides model names behind letters, and I do not map them to vendors. Twelve models have more than 20,000 clean calls each. I sorted them by the ratio of the 5-6 minute share to the 4-5 minute share: under 0.25 is a cliff, 0.25 to 0.8 a partial drop, above 0.8 no 5-minute drop. Values in parentheses are thin: under 1,000 calls or 200 sessions.
| Model | Clean calls | 4-5 min | 5-6 min | 10-30 min | 30-55 min | 2-24 h | Shape |
|---|---|---|---|---|---|---|---|
| A | 2,288,681 | 65.8 | 7.8 | 3.8 | 3.8 | 3.9 | 5-min cliff |
| B | 1,247,048 | 53.0 | 7.1 | 3.6 | 3.4 | 3.6 | 5-min cliff |
| C | 931,123 | 60.7 | 5.5 | 2.3 | 2.6 | 2.5 | 5-min cliff |
| F | 785,464 | 74.3 | 46.6 | 41.6 | 27.6 | 5.4 | Partial drop |
| E | 732,262 | 54.3 | 4.8 | 2.4 | 2.2 | 2.4 | 5-min cliff |
| D | 725,163 | 80.6 | 78.8 | 72.0 | 59.4 | 2.8 | No 5-min drop |
| H | 415,031 | 63.2 | 5.9 | 2.7 | 3.2 | (2.4) | 5-min cliff |
| I | 380,888 | 77.9 | 78.5 | 71.5 | 64.9 | 11.8 | No 5-min drop |
| G | 367,190 | 60.5 | 4.0 | 1.5 | 1.5 | 1.6 | 5-min cliff |
| J | 170,832 | 78.1 | (77.0) | 58.8 | (15.9) | (0.7) | No 5-min drop |
| K | 148,246 | (75.6) | (77.5) | 33.7 | (0.8) | (0.1) | No 5-min drop |
| L | 107,353 | (57.9) | (3.1) | 0.7 | (0.4) | (0.5) | 5-min cliff |
Seven models fall to 3-8% at 5-6 minutes, then stay between 0.4% and 4.4% out to a day. Model F loses 37% of its share at 5 minutes. Four models hold 75 to 79% at 5 to 10 minutes and lose half their share somewhere between 10-30 minutes and 2-24 hours.
Now the mixture. Clean calls after 5 minutes or more carry 24.39B prompt tokens:
- The seven cliff models hold 66.7% of those tokens, at 3.5% cached.
- Model F holds 5.6%, at 37.1% cached.
- The four no-drop models hold 22.7%, at 61.3% cached.
Pooled, those tokens are 19.1% cached, and the four no-drop models supply about 14 of those points. At 10-30 minutes, no model in the table sits near the pooled share.
There is no pooled cliff at 1 hour. User-opened calls are 13.2% [11.9, 14.5] cached at 55-60 minutes and 11.8% [10.4, 13.1] at 60-65 minutes. The intervals overlap, and the decline after that is gradual, down to 3.6% at 2-24 hours. Model D falls from 59.4% at 30-55 minutes to 11.0% at 65 minutes to 2 hours, but its bins near the hour are thin, so I cannot place that edge.
Medians say zero
The paper's Figure 15 reports medians, and so did my field guide: near 0 to 5% after more than 10 minutes idle (paper). On the same rows, I get medians of 0. The token-weighted share is 18.1% at 10 minutes to 1 hour and 5.4% past 1 hour.
The two numbers answer different questions. A median says what the typical call saw. A token-weighted share says how many of the prompt tokens the server could reuse.
Below 5 minutes, the median flatters. At 4-5 minutes, the median user-opened call is 92.0% cached, but the share is 64.2%. Read the median and you expect 8% of prompt tokens uncached. The tokens say 35.8%.
Past 5 minutes, the cost piles up. Calls that come 5 minutes or more after the previous LLM call are 3.65% of calls and 4.17% of prompt tokens. They carry 23.85% of all uncached prompt tokens: 21.57B of 90.45B. Their median is 0, and 59.5% of them round to 0% cached. The user-opened ones among them carry 21.4% of all uncached prompt tokens.
The direction matches FreeInference, the gateway trace in the field guide. The level does not: about 58% cached at 15-30 minutes there (paper), against 19.2% here for user-opened calls. The two may define a hit differently.
What a harness can do with five minutes
This part is my read unless a source is named. I have not tested any of it.
- Treat 5 minutes as a deadline. On a cliff model, the cache does not fade. It goes. A harness often knows a pause is coming: a long test run, an approval prompt, a question for the user. A 6-minute test suite costs the cache what a 6-minute coffee break does. The trace measures from the end of the previous call, so start the clock there.
- Keep the cache warm near 4 minutes. A keepalive replays the prefix on a timer during a pause. One paper finds the cheapest interval is the largest one safely under the TTL: about 4 minutes for a 5-minute TTL (keepalive economics, paper). This trace argues for that margin, because the slide starts in the 270-300 s bin. Each keepalive is a call you pay for, so it fits pauses that end, like tool runs and approvals, better than a closed laptop.
- Know the size of the prize. If every call after 5 minutes or more had kept the 4-5 minute share of 64.0%, total uncached prompt tokens on this trace would fall 13.4%. That is arithmetic on this trace, not a forecast.
- Put retention in the model choice. At 10-30 minutes, Model D keeps 72.0% cached and Model A keeps 3.8%. If your users pause, a provider's retention terms matter next to its price. The letters do not map to vendors, so read your provider's terms.
- Report token-weighted share by gap, next to the median. A median of 0 and a share of 18.1% describe the same calls.
How I measured
- Data. Release
ghcp-coding-agent-2026of the Azure Public Dataset: seven daily archives for June 1 to 7, 2026, 3.22 GB, under CC BY 4.0. It holds 301,026 sessions sampled from non-enterprise users. One Python process, standard library only, streamed all of it in 487 seconds. - Calls. 9,055,142 LLM calls with a prompt above 0. I left out the release's
tool-modellabel. - Gap. A call's start minus the latest end of any earlier LLM call in the same session. It ignores turn boundaries.
timestampis the call's end. The dataset docs do not say, and the authors' loader reads it as the start. The data disagrees. Read as the start, 48.01% of 15.8M consecutive pairs in a turn overlap by more than half a second. Read as the end, 0.017% do. So a call starts attimestampminusduration_ms.- Share. The sum of cached tokens, capped at the prompt, over the sum of prompt tokens in a bin. The 95% intervals are ratio-estimator intervals clustered by session, because calls in one session are not independent.
- Clean. The call succeeded, used the same model as the previous call, and was not flagged as compaction. The tables use clean calls.
- Replication. The counts match the dataset card exactly: 301,026 sessions, 1,189,581 turns, 9,310,255 LLM calls, 7,767,261 tool batches and 8,681,190 tool calls. With the authors' code paths and their reading of
timestamp, the mean per-call rate is 91.6% within a turn against the paper's 90%, and 55.2% across turns against 55% (paper). Figure 15's rule gives 818,968 rows against the authors' notebook's 818,990, and the medians match from 5 seconds on. Two numbers deviate, and I did not find why: the drop on a model switch (47 points against 67) and the share of sessions with compaction (8.5% against 7.8%). - Criteria. Before the run, I set go/no-go criteria in a session plan. The post would go ahead only if the new cuts showed something Figure 15 cannot: a cliff placed within one bin, a clear tool-wait answer from at least 1,000 calls, models a retention class apart, or medians and shares 10 or more points apart. All four held, the first at 5 minutes and not at 1 hour. I did not commit the plan anywhere, so that order rests on my session log.
Limits
- Many backends. The cached count is what each provider's backend reported. A miss can be expiry, routing to a replica without the prefix, or eviction under memory pressure. The trace cannot separate them. The 300-second edge points at retention for the cliff models, nothing more.
- One week, one sample. The trace covers June 1 to 7, 2026. June 6 and 7, a weekend, have about a fifth of the weekday sessions. Provider policies may have changed since. The release is 301,026 sampled sessions from non-enterprise users; the paper covers 13M. I did not test how representative the sample is.
- Vendor-authored. Microsoft builds the product, wrote the paper and released the data.
- Anonymized models. The letters cannot be mapped to vendors or their published policies. One letter may also merge model versions.
- Associations. Long gaps come from different sessions and moments, and tool time may include approval waits that the trace does not record. The tool-wait result and the per-model shapes point at elapsed time, but do not prove it.
- Timing. Timestamps come from the client, and the first call of many turns sits on a 10-second boundary. If
timestampis the start after all, every gap shifts by one call duration. The overlap test makes that unlikely. - No prompt content. The share is over all prompt tokens, not over the part that could be reused.
Measured: 31 October 2026.
Run it yourself
Download the analysis script (Python) Download Figure 1 (SVG)
The script needs only Python 3. The download step fetches 3.22 GB, capped at 2 MB/s, resumes if interrupted and checks each archive's SHA-256.
nice -n 19 python3 analyze.py download
nice -n 19 python3 analyze.py run       # about 8 minutes on one core
nice -n 19 python3 analyze.py report
Data goes to ~/data/ghcp-coding-agent-2026/ and results to its out/ folder: a JSON file, Markdown tables and the figure. For a quick check, add --max-sessions 500 --tag smoke to run and report. Figure 1 is the report's figure in this site's colours and font. No point moved.
The agent will wait for you as long as you like. On most of this traffic, the cache gives you five minutes.