Most LLM benchmarks start with one precise number:
Time to first token: 412 ms.
Time to first token (TTFT) should track what a user waits to see. Here, it means the client-observed time from request start to the first non-empty visible content delta.
But what arrived after 412 milliseconds? Was it the first word shown to the user? An empty server-sent event? Hidden reasoning metadata? Or did the HTTP client buffer several events and hand them to the benchmark at once?
I ran into all four cases while building the streaming API collector in LLMTraceFX.
My benchmark repeated the same result. It was still timing the wrong boundary.
The 8 KB buffering bug
The first implementation read an HTTP response in 8 KB blocks:
chunk = response.read(8192)
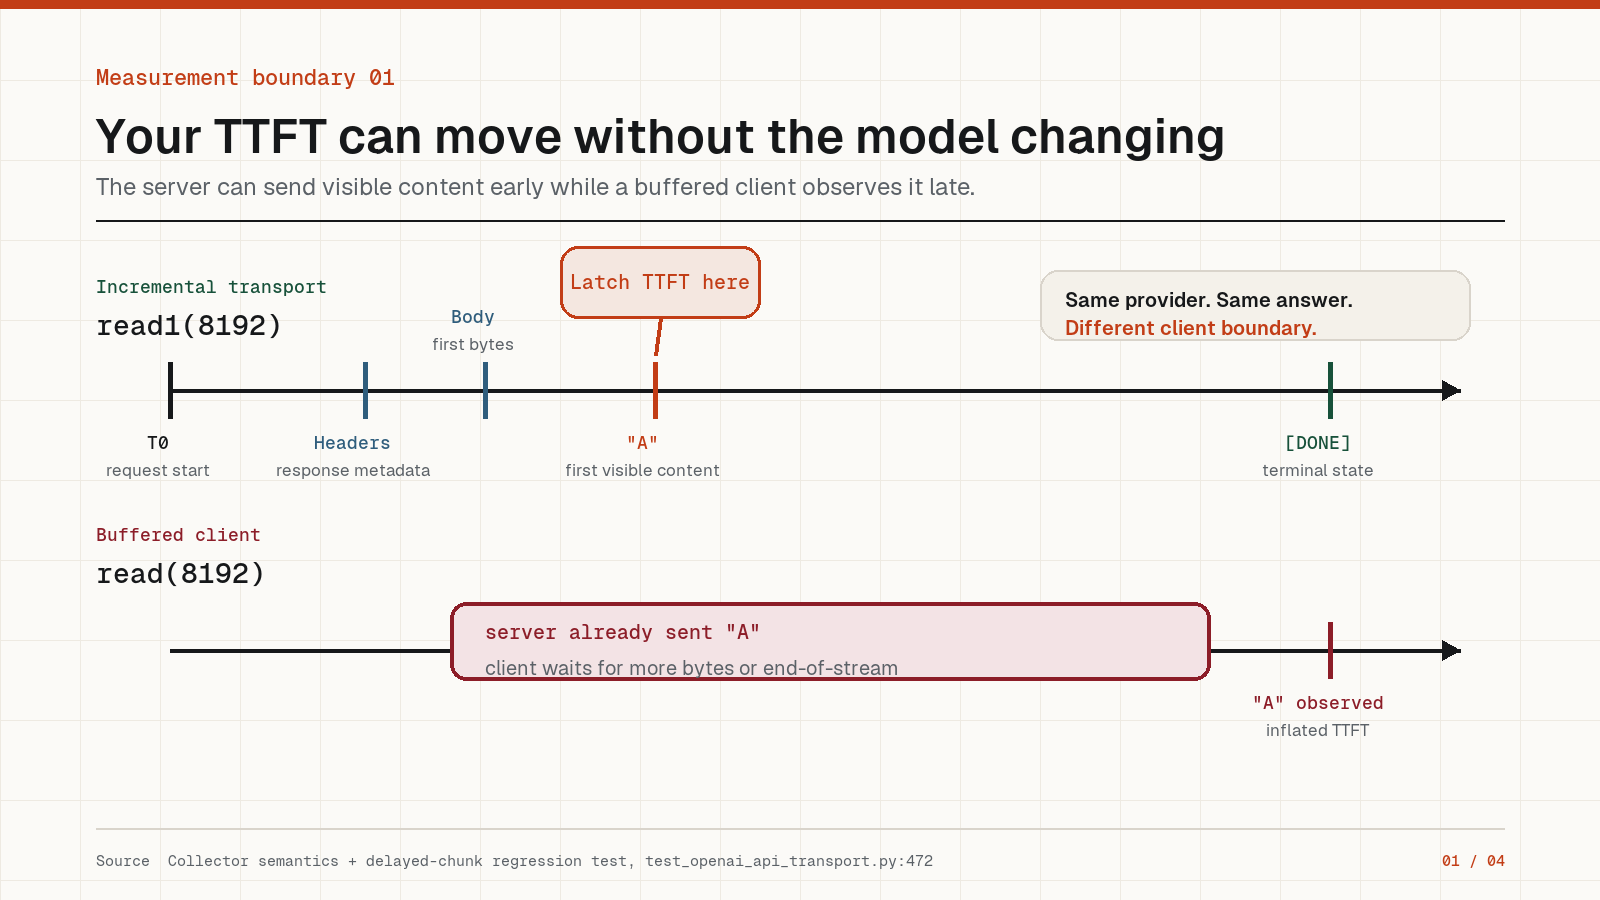
That read looks harmless. But it can wait too long for a streaming response.
Python's HTTP response reader may continue across multiple transport chunks until it fills the requested amount, reaches the end, or times out. A provider can send visible content at once while the collector observes it much later.
The measured TTFT then includes client-side buffering. For a short response, several server-sent events can arrive together near the end. The client makes TTFT, inter-token latency, and throughput look worse than the stream was.
I changed the collector to use an incremental read. Then I tested it against a local chunked-transfer server that delays small frames. The test checks more than the final response. It requires the first visible content to arrive before the stream ends.
A controlled client-only measurement
I measured the two read primitives directly. A loopback HTTP/1.1 server sent the same 67-byte visible-content frame after 20 ms, held the terminal frame for another 180 ms, and then closed normally. I ran 20 trials per primitive with an 8 KB requested read.
read1(8192)median first return: 25.008 msread(8192)median first return: 210.076 ms- Added client observation delay: 185.068 ms
- Buffered path: 8.4x as long
The server sent the same bytes on the same schedule. I changed only the client read.
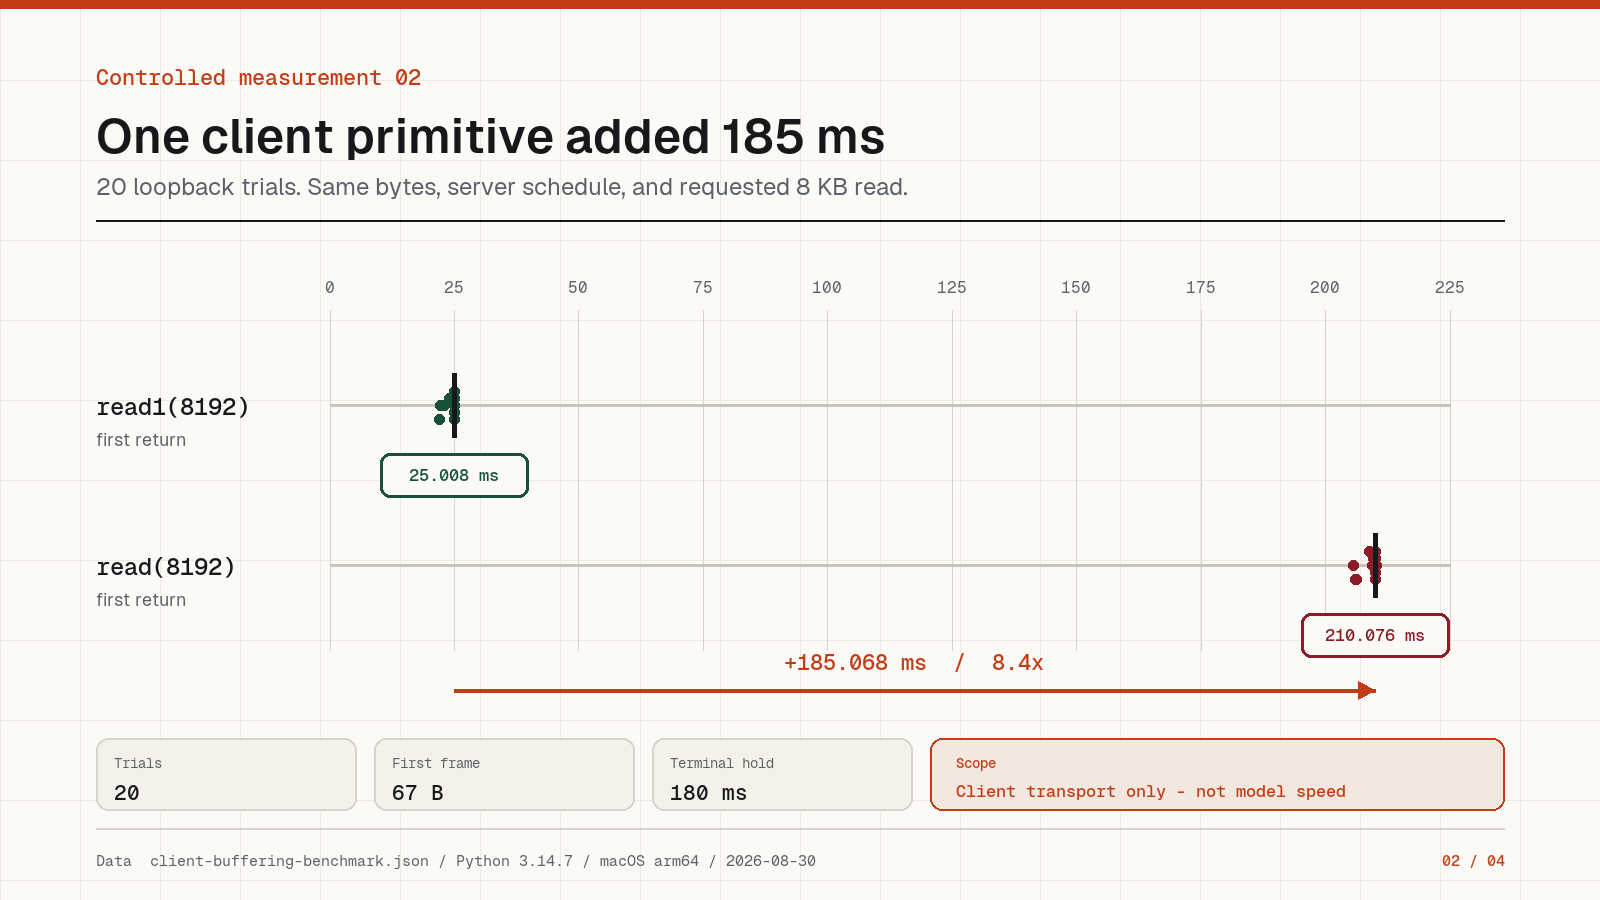
These numbers describe one controlled transport experiment. They do not compare models or providers. They do not measure queue time, prefill, decoding, kernel work, or GPU performance.
The first event is not always the first token
OpenAI-compatible streaming APIs can emit several things before visible text:
- comments and keepalives
- role metadata
- empty content deltas
- provider identifiers
- hidden reasoning deltas
- usage-only events
Counting any of these as visible output makes TTFT look better than the wait a user feels.
The collector starts TTFT only when it sees non-empty visible content. It records response-header and first-body-byte offsets separately. It counts reasoning deltas without keeping their text. It also keeps provider-reported token usage separate from client-observed timing.
The report can then say what the client measured without pretending it can see server-side prefill, queueing, or kernel execution.
Partial output is still a failed run
I also found that non-empty output did not always mean success.
Imagine this stream:
- The provider sends half an answer.
- The connection closes.
- No terminal finish reason arrives.
- No
[DONE]sentinel arrives.
The text is real. The timing is real. The run is not complete.
A benchmark that records this as success rewards broken streams with shorter latency. LLMTraceFX keeps the partial evidence but marks the run as truncated. A documented terminal reason or valid completion sentinel is required before the response counts as complete. Provider failure reasons remain failures even if a later sentinel arrives.
A failed stream should never earn a better score.
A tokens-per-second number needs provenance
An SSE delta is not necessarily one token.
A provider may place several tokens in one delta, split one token across transport boundaries, or report reasoning tokens that the client never observed.
The collector separates:
- content-delta arrival rate, derived from observed events
- provider-reported completion-token rate
- visible-content timing
- provider-reported reasoning and cached-token usage
Missing evidence stays missing. It does not become zero.
If a provider reports reasoning tokens but the client never observed the reasoning interval, the collector does not divide those tokens by the shorter visible-content window. That would produce a faster number from a shorter window that the client did not observe.
The collector also has to protect secrets
A remote collector needs an API key. That makes the profiler part of the security boundary.
The key should not appear in reconstructed commands, request plans, exceptions, response text, provider request IDs, rate-limit headers, output paths, or configuration hashes.
Replacing one exact string is not enough. A provider can echo a credential with different casing, whitespace, URL encoding, or JSON escaping. It can split the value across streaming deltas. A truncated error can expose all but the final character. A command-line typo can make an argument parser repeat the value in its error.
The collector keeps credentials in environment variables, rejects unsafe configurations before network access, redacts provider-controlled values, and writes a completion marker with hashes for the final artifact set.
A benchmark can leak a key even when it never prints one on purpose. I now treat every provider-controlled field as untrusted.
Evidence without a paid request
The collector has a dry-run path that writes an inspectable request plan without reading a credential or making a network call.
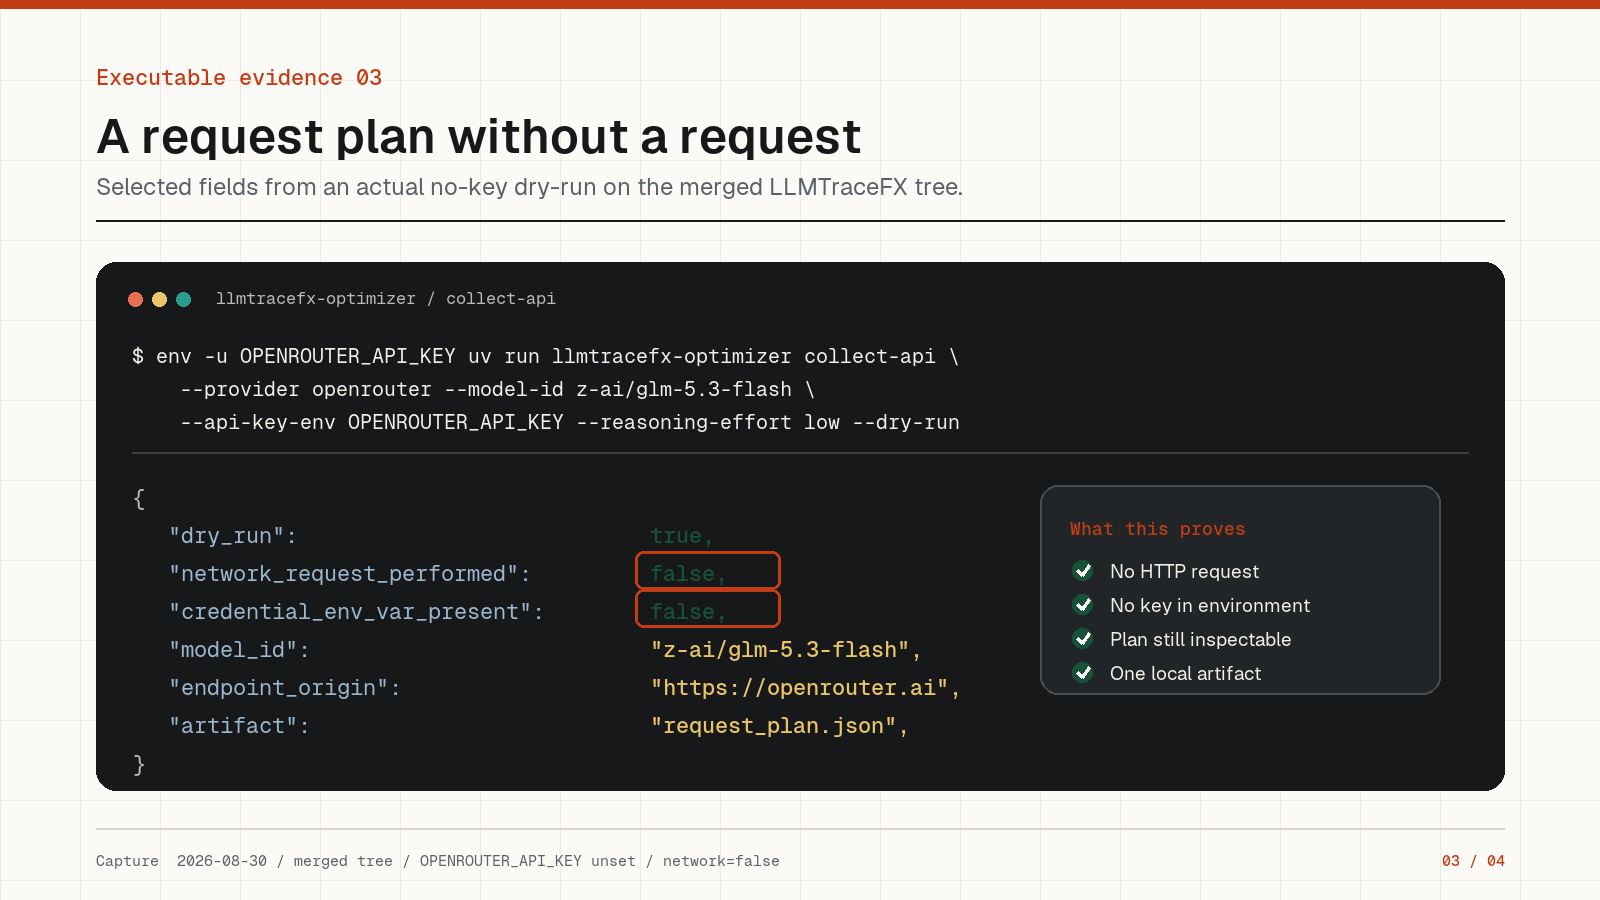
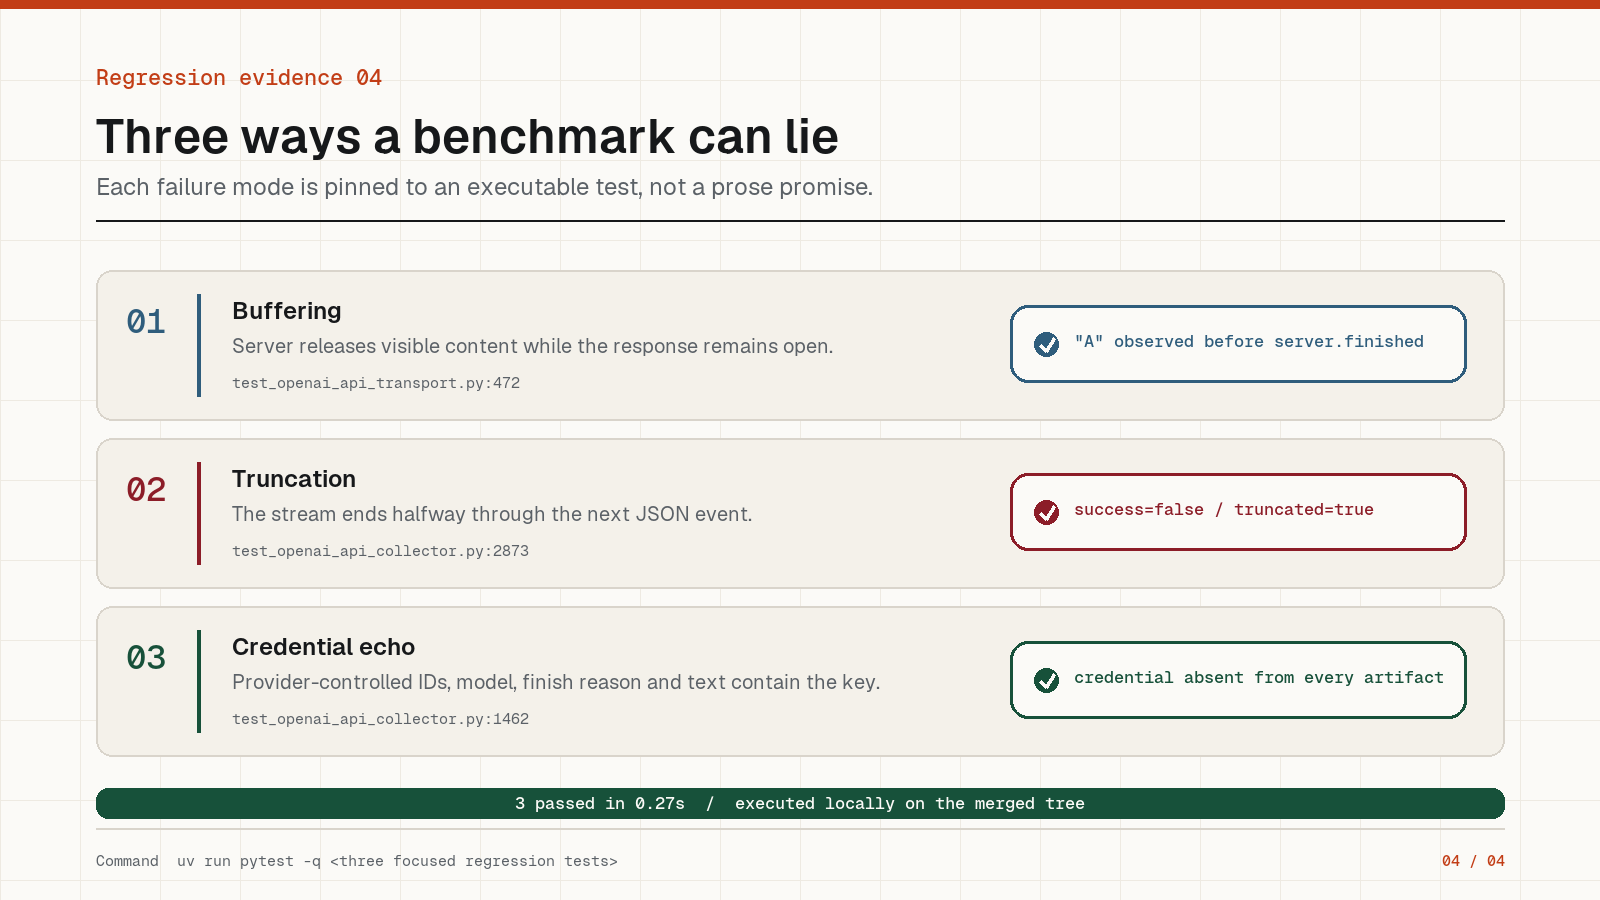
network_request_performed: false and credential_env_var_present: false. The dry run still wrote a request plan. Open the full-size proof.The regression tests cover the timing boundary, failure semantics, and credential handling without calling a real API.
Reproduce it
The controlled benchmark needs only Python. It starts a loopback HTTP/1.1 server, runs 20 trials for each read primitive, and writes the samples to JSON. It makes no external network request.
Download the measurement harness (Python) Download the recorded samples (JSON)
python3 collect_buffering_metrics.py \
  --output client-buffering-benchmark.json
To run the three focused LLMTraceFX regressions:
git clone https://github.com/Siddhant-K-code/LLMTraceFX
cd LLMTraceFX
uv sync --extra dev --extra test
uv run pytest -q \
  tests/optimizer/test_openai_api_transport.py::test_first_content_is_observed_before_the_stream_completes \
  tests/optimizer/test_openai_api_collector.py::test_a_stream_cut_after_partial_content_is_truncated_not_successful \
  tests/optimizer/test_openai_api_collector.py::test_a_provider_echoing_the_credential_everywhere_leaks_nothing
I am not publishing cross-system benchmark numbers from this test. If my client cannot say what it observed, its TTFT number is not ready to compare.
About LLMTraceFX
LLMTraceFX is an open-source, evidence-first toolkit I am building to understand and improve local and hosted LLM inference. It collects reproducible evidence, verifies workload quality, compares systems on like-for-like work, and leaves unsupported metrics empty instead of turning them into confident numbers.
It is still growing. If this approach is useful to you, I would appreciate you exploring the GitHub repository, sharing feedback, opening an issue, or giving it a star. Each one helps me learn what to improve next.
I write about AI agent infrastructure, security, context engineering, and the human side of building with AI. You can find all my writing on my writing page. Discuss this with me on X or connect with me on LinkedIn.