The number 7,585 looked important. It was also the wrong unit.
That was the count of reference cells in one xctrace XML export. The workload had issued 400 Metal dispatches. Getting to those 400 records required inspecting 13,068 cells, resolving 7,585 references, and filtering 726 selected-schema intervals by process identity.
My previous Metal article explains why process attribution matters. This one stays inside the parser: how it resolves references, keeps rows intact, handles missing values, and proves that 400 target-PID intervals mean 400 workload dispatches.
The result is about record identity and count. It says nothing about GPU time, utilization, or performance.
The export looks like a table
The capture came from this environment:
- Apple M5 Pro, arm64
- macOS 26.6.2 (25G83)
- Xcode and Instruments 26.6
xctrace16.0 (17F113)- Metal System Trace
Each export advertised 82 schemas. LLMTraceFX selected metal-gpu-intervals, which had 18 columns.
That sounds simple: choose a schema, visit each row, read 18 cells.
But a cell does not always hold its value. Some values appear inline. Other cells carry a ref that points to an element materialized elsewhere in the document. The row still owns the column position, but the value lives at another node.
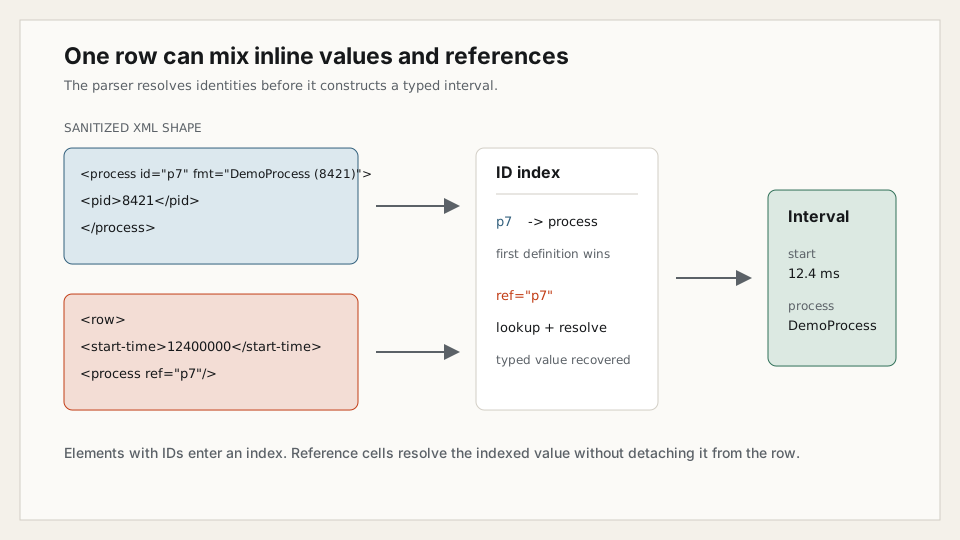
A reduced, invented shape preserves the public format idea without copying private trace data. The node <process id="p7"> defines the process. A later row uses <process ref="p7"/> to point back to it.
Simple row iteration sees a process cell with no text. A reference-aware parser follows p7, recovers the structured process value, and leaves it attached to the row's process column. Figure 1 traces that resolution.
Build the identity index first
The LLMTraceFX parser starts by indexing every XML element with an id.
The first definition for an ID wins. The index exists for one parse_exported_table() call. It is not a global cache and does not survive across exports.
When a cell carries ref="p7", the resolver walks the reference chain until it reaches a value. It refuses two bad shapes:
- a reference to an ID that does not exist
- a cycle that returns to an ID already visited
Both stop parsing with InstrumentsExportError. A missing process is not invented. A cycle is not truncated into a plausible value.
The parser also checks the engineering type twice: once on the cell in the row and once on the element reached through the reference. A process column cannot point at a duration value just because both nodes have valid IDs.
This is why I think of the export as a graph laid over a table. Column position gives each cell meaning. Reference edges recover the value. Both have to agree before a row is safe to use.
Position is part of the contract
The association between rows and columns is positional. A row's first direct child belongs to the first schema column, the second child to the second column, and so on.
LLMTraceFX requires every row to have the same number of direct children as the schema has columns. For this table, that means 18. A short or long row fails instead of shifting later values into the wrong fields.
It then checks that each child matches the column's declared engineering type. The check applies to inline and referenced values.
Those rules prevent a dangerous class of parser bugs. If one optional cell vanished and the parser compressed the row, a duration could become a process, or a process could become a label. The output might still have 18 tidy keys. They would describe the wrong record.
Keep process identity structured
For process cells, the parser prefers the structured <pid> child and parses it as an integer. If that field is unavailable, it can recover a trailing PID from the formatted process label. If neither path works, the PID remains None.
The summary groups process ownership by (pid, label), not by label alone. Two processes with the same display name stay separate. If one PID appears under two labels, for_process(pid) raises AmbiguousProcessError instead of choosing one.
This matters because process attribution is the last reduction in the pipeline:
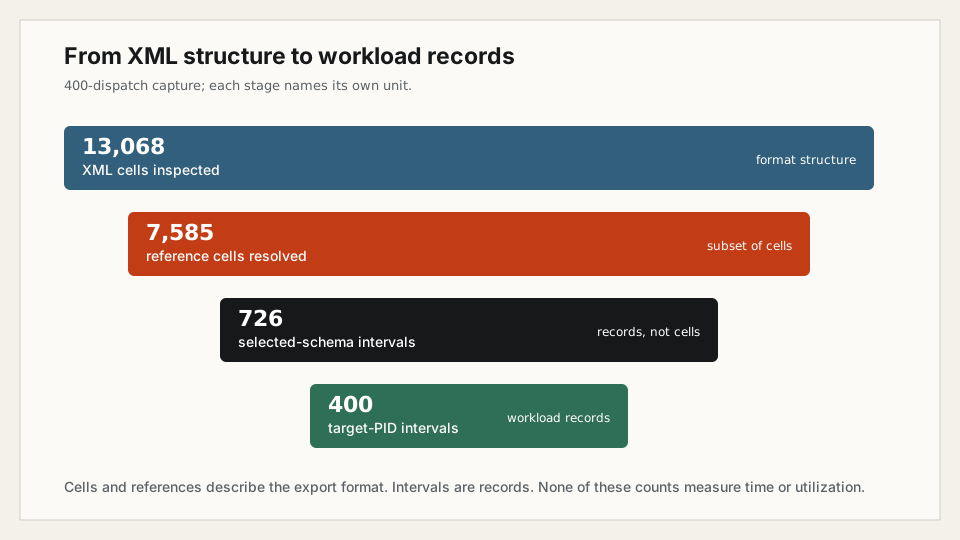
The 400-dispatch capture contained:
- 13,068 XML cells across the selected export.
- 7,585 reference cells inside that XML structure.
- 726
metal-gpu-intervalsrecords across all processes. - 400 records for the target PID.
The other 326 intervals belonged to known unrelated processes. No interval was unattributed.
Cells are not intervals. References are not intervals. Intervals are not nanoseconds. None of these counts is GPU utilization.
A sentinel keeps an empty slot empty
Xcode 26.6 can emit <sentinel/> for an absent optional value. The element still occupies a column position, so deleting it would corrupt every association to its right.
The parser accepts a sentinel in place of a typed cell. What happens next depends on the field:
| Field contract | Example | Result |
|---|---|---|
| Optional | frame | Position is preserved and the value remains null. |
| Required numeric | start or duration | Summarization fails because the cell has no text. |
| Required process | process | The interval remains counted with pid=None and is explicitly unattributed. |
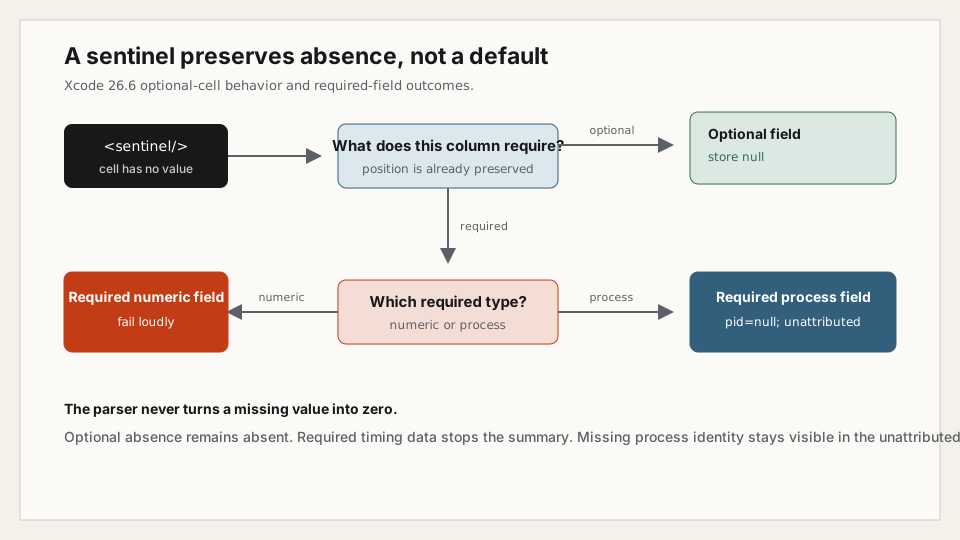
This split is deliberate. Missing timing data makes the interval unsafe to summarize, so the operation fails. Missing process identity does not erase the interval, because that would make the all-process total look complete. It stays visible in the unattributed count.
In all five captures summarized in the committed bundle, that unattributed count was zero.
A plausible total is not proof
Reference resolution can fail quietly in a naive parser. A program can skip empty-looking cells, count the rows it did construct, and print a number that looks reasonable.
Reasonable is not an oracle.
The test workload gave me one. It issued a known number of Metal dispatches, with one command buffer per dispatch. Before parsing each capture, I already knew the expected target-PID interval count.
| Known dispatches | Exported cells | Reference cells | All-process intervals | Target-PID intervals | Match |
|---|---|---|---|---|---|
| 400 | 13,068 | 7,585 | 726 | 400 | Yes |
| 250 | 7,092 | 4,035 | 394 | 250 | Yes |
| 120 | 4,140 | 2,384 | 230 | 120 | Yes |
| 77 | 3,258 | 1,884 | 181 | 77 | Yes |
| 133 | 4,554 | 2,630 | 253 | 133 | Yes |
Every target-PID count matched its controlled dispatch count. The exports changed in size. The amount of unrelated process activity changed. The target path still landed on the known answer five times.
That does not prove every possible xctrace document will parse. It does show that schema selection, positional mapping, reference resolution, process extraction, and target attribution held together across five different inputs.
What the evidence does not prove
The parser refuses malformed XML, DOCTYPE and entity declarations, the wrong root, a missing or unexpected schema, duplicate column names, row-width mismatches, engineering-type mismatches, dangling or cyclic references, invalid integers, negative durations, and implausible timestamps.
Only metal-gpu-intervals is supported. The other advertised schemas remain unsupported rather than guessed at.
These checks are not defensive decoration. Without them, the parser can produce a clean aggregate after losing the meaning of a cell.
The public evidence also leaves unsupported metrics empty. These interval counts do not support claims about:
- GPU utilization or busy percentage
- kernel time
- memory bandwidth
- occupancy
- power or energy
- GPU memory footprint
The evidence answers one question: did the parser recover and attribute the expected interval records?
Publish the derivation, not the desktop history
Raw Instruments artifacts can expose more than GPU work. A trace, table of contents, or XML export may contain a device name, hardware UUIDs, target arguments, local paths, and labels for unrelated processes active during the capture.
That is why this article uses a made-up XML fragment and sanitized derived counts. The public LLMTraceFX bundle does not include .trace packages or raw XML.
Before writing public files, the evidence tool strips device names, device UUIDs, and process arguments from the table of contents. It rejects home-directory paths, UUIDs, email addresses, credential-shaped strings, raw trace paths, unexpected files, directories, and symlinks. It then verifies each allowed file against SHA256SUMS.
The capture manifest, JSON summary, CSV summary, and checksums are pinned to the merged evidence commit.
Reproduce the public checks
You do not need a new capture to inspect the parser contract or verify the published bundle:
git clone https://github.com/Siddhant-K-code/LLMTraceFX.git
cd LLMTraceFX
git checkout 4763067c81697d907bdd048ca1b6067cffe0698f

uv sync --locked --extra dev --extra test
uv run pytest tests/optimizer/test_instruments_export.py -q
uv run python examples/metal_evidence/evidence_demo.py verify \
  --public-dir examples/metal_evidence/public
The pytest command checks inline and referenced values, row width, engineering types, sentinels, process identity, ambiguity, and failure paths. The verification command checks public-file hashes, privacy rules, count arithmetic, and exact dispatch matches.
The merged evidence guide also documents the optional fresh-capture flow for a compatible Mac. It is not required to reproduce the checks above.
What I learned
- Table-shaped XML may still need graph-like reference resolution. Rows describe position while ID and
refedges recover values. - Dereferencing must not detach a value from its row, column, process label, or PID.
- Missing data must fail closed. Optional sentinels can remain null. Required numeric sentinels stop the summary. Required process sentinels stay explicitly unattributed instead of entering the target count.
- A plausible total is not parser proof. Known dispatch counts provide an external oracle that the parser cannot manufacture.
- Privacy-safe derived evidence is more useful to publish than raw traces that expose device and process history.
A parser checklist
When parsing a profiler export:
- Pin the tool version, export schema, and expected columns.
- Index identities before reading rows, then reject dangling and cyclic references.
- Enforce row width and engineering type before mapping values to columns.
- Preserve structured process identity through every dereference and aggregation.
- Define optional and required missing-value behavior per field. Never turn absence into zero.
- Reject ambiguous owners, malformed values, and unsupported schemas instead of guessing.
- Test against an input known outside the parser, not only a tidy aggregate.
- Publish sanitized summaries, hashes, and reproduction steps. Keep raw captures private unless users have reviewed every field.
Conclusion
Treat profiler XML as a typed identity problem before treating it as a collection of rows. Keep position and ownership attached, make missing required data visible, and validate the final path against an external oracle.
The five exact dispatch matches support this parser path for these metal-gpu-intervals exports. They do not prove that every xctrace schema will parse, and they do not measure GPU utilization, time, bandwidth, occupancy, power, energy, or memory.
About LLMTraceFX
LLMTraceFX is an open-source, evidence-first toolkit I am building to understand and improve local and hosted LLM inference. It collects reproducible evidence, verifies workload quality, compares systems on like-for-like work, and leaves unsupported metrics empty instead of turning them into confident numbers.
It is still growing. If this approach is useful to you, I would appreciate you exploring the GitHub repository, sharing feedback, opening an issue, or giving it a star.
I write about AI agent infrastructure, security, context engineering, and the human side of building with AI. You can find all my writing on my writing page. Discuss this with me on X or connect with me on LinkedIn.